Asks which organisations can show that OOH exposure caused incremental impact, and turn that evidence into the next media decision. The paper extends the measurement chain from three stages to seven and finds that none of the eight organisations assessed documents all of them.
3 → 7stages in the proposed OOH proof chain
Abstract
A preceding analysis in this series mapped which organizations measure out-of-home (OOH) and digital out-of-home (DOOH) exposure and brand lift. This article asks a harder and structurally different question: which organizations can demonstrate that OOH exposure caused incremental impact, and convert that evidence into the next media decision. It proposes extending the OOH measurement chain from three stages, delivery, exposure, and brand lift, to seven: delivery, exposure, attention, brand lift, causality, business outcome, and optimization. The article situates this extension within verified 2025-2026 developments: the World Out of Home Organization's report of 54.2 billion dollars in global OOH expenditure, of which DOOH represented 25.5 billion dollars; the inaugural WOO/PwC supply-side estimate of 1.339 billion dollars in programmatic DOOH, 7.0% of DOOH; the finalization of the IAB and Media Rating Council Attention Measurement Guidelines in November 2025; the IAB DOOH Measurement Guide's recommendation of synthetic control and matched market and store testing for incrementality; and the IAB and IAB Europe incrementality guidelines of November 2025, which rank measurement methods by causal strength. The article distinguishes exposure from attention, attention from outcome, brand lift from causality, and attribution from incrementality, and applies a weighted, eight-dimension capability framework, termed the OOH Brand Lift Power Index 2.2, to eight organizations: Kantar, Nielsen, Happydemics, Vistar Media, Broadsign, On Device Research, Quividi, and Lemma. Its central finding is that none of these organizations publicly documents capability across the full seven-stage chain. The article terms this the OOH outcome-intelligence gap and argues that the principal competitive opportunity through 2030 lies in connecting credible evidence across the chain rather than in any single measurement capability.
Keywords
Out-of-Home Advertising
Digital Out-of-Home
Brand Lift
Incrementality
Causal Inference
Attention Measurement
Attribution
Programmatic Advertising
Marketing Effectiveness
Advertising Measurement Standards
The full paper
Read the paper
The complete text, figures, tables and references, read here. Or see the original pages, or open the PDF.
1. Introduction: From Measuring the Players to Measuring the Proof
The first edition of this analysis asked who is measuring OOH brand lift, exposure, and audience impact. Its answer was a landscape: a set of specialists, each strong in part of the measurement chain. This second edition, designated V2.2 within the series and organized around an analytical framework termed the OOH Brand Lift PowerPlay 2.2, does not extend that landscape. It asks a different question: who can prove that OOH exposure caused incremental impact, and turn that proof into the next media decision.
That shift matters because a measurement landscape and an operating model are different things. An organization can measure exposure, awareness, recall, footfall, sales, or attention very well without being able to connect those signals into one causal and actionable system. The article proceeds as follows. Section 2 sets out the market context. Section 3 explains why the three-stage chain is no longer sufficient and proposes a seven-stage replacement. Sections 4 through 8 examine each new stage: attention, brand lift, causality, business outcomes, and optimization. Section 9 addresses the role of artificial intelligence. Sections 10 through 12 examine eight organizations, apply the Power Index 2.2, and identify the outcome-intelligence gap. Sections 13 through 16 present the global view, a clearly labelled 2030 scenario, five structural problems, and five industry moves. The article closes with its limitations and thesis.
2. Market Context: Why Measurement Quality Now Matters
The World Out of Home Organization reports global OOH expenditure of 54.2 billion dollars in 2025, 5.1% of global advertising expenditure, with DOOH at 25.5 billion dollars, approximately 47% of OOH revenue, and forecasts DOOH of approximately 28 billion dollars, around 49% of OOH, in 2026 (World Out of Home Organization, 2026a). At that scale, the quality of the evidence behind an OOH investment becomes a strategic question rather than a technical one.
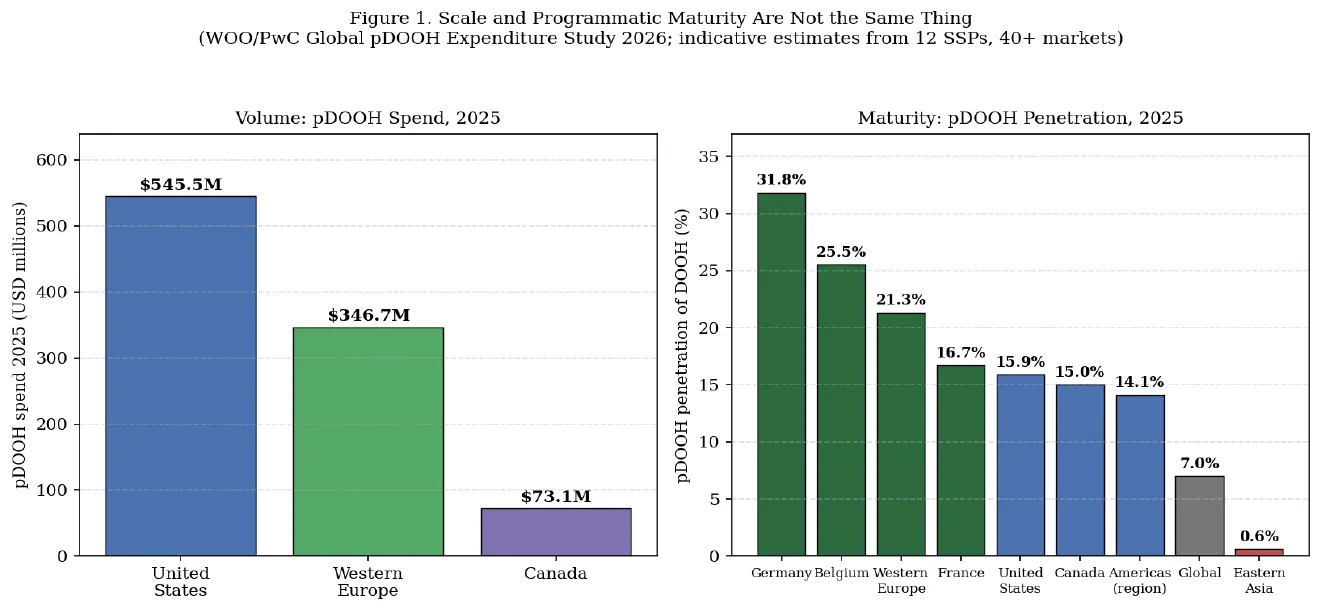
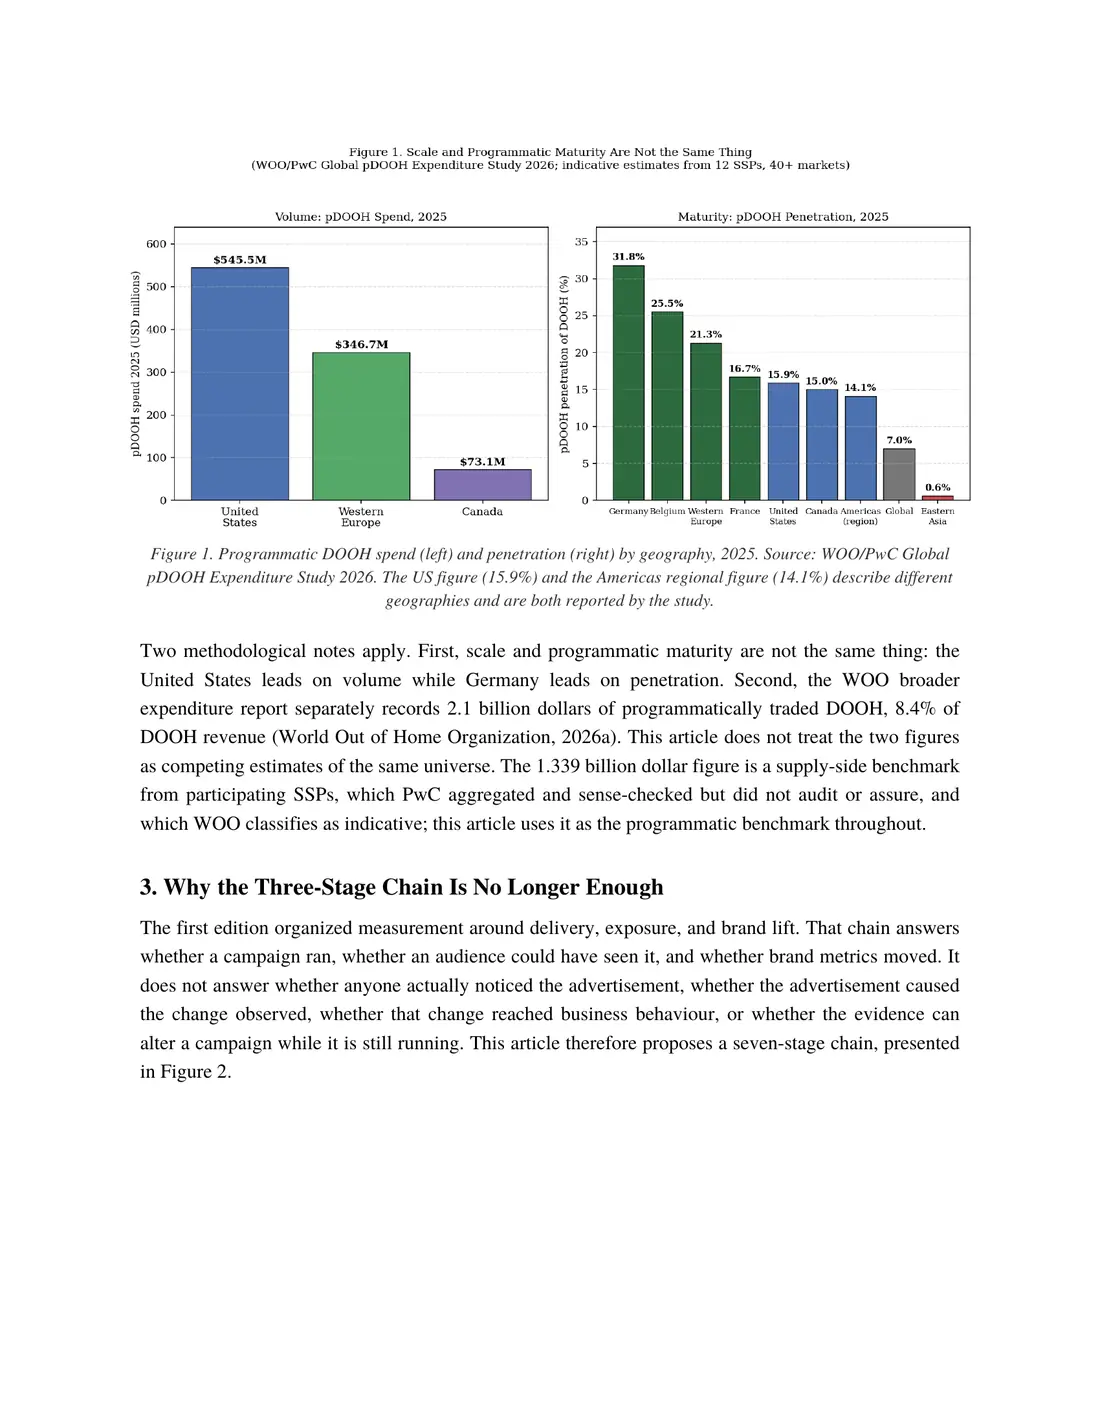
Programmatic DOOH is smaller but increasingly important. The inaugural WOO Global pDOOH Expenditure Study, based on confidential revenue submissions from twelve supply-side platforms across more than 40 markets and aggregated by PricewaterhouseCoopers, estimates 1.339 billion dollars of programmatic DOOH revenue in 2025, 7.0% of DOOH. The United States is the largest market by volume at 545.5 million dollars, 15.9% of US DOOH, within an Americas region at 14.1% penetration; Western Europe reached 346.7 million dollars at 21.3%; Germany recorded 31.8%, the highest of any major market; and Eastern Asia, despite a 7.3 billion dollar DOOH base, recorded 0.6%. Private marketplaces accounted for 75.7% of spend, and OOH-specialist demand-side platforms for 65.5% (World Out of Home Organization/PwC, 2026). Figure 1 presents these figures.
Figure 1. Programmatic DOOH spend (left) and penetration (right) by geography, 2025. Source: WOO/PwC Global pDOOH Expenditure Study 2026. The US figure (15.9%) and the Americas regional figure (14.1%) describe different geographies and are both reported by the study.
Two methodological notes apply. First, scale and programmatic maturity are not the same thing: the United States leads on volume while Germany leads on penetration. Second, the WOO broader expenditure report separately records 2.1 billion dollars of programmatically traded DOOH, 8.4% of DOOH revenue (World Out of Home Organization, 2026a). This article does not treat the two figures as competing estimates of the same universe. The 1.339 billion dollar figure is a supply-side benchmark from participating SSPs, which PwC aggregated and sense-checked but did not audit or assure, and which WOO classifies as indicative; this article uses it as the programmatic benchmark throughout.
3. Why the Three-Stage Chain Is No Longer Enough
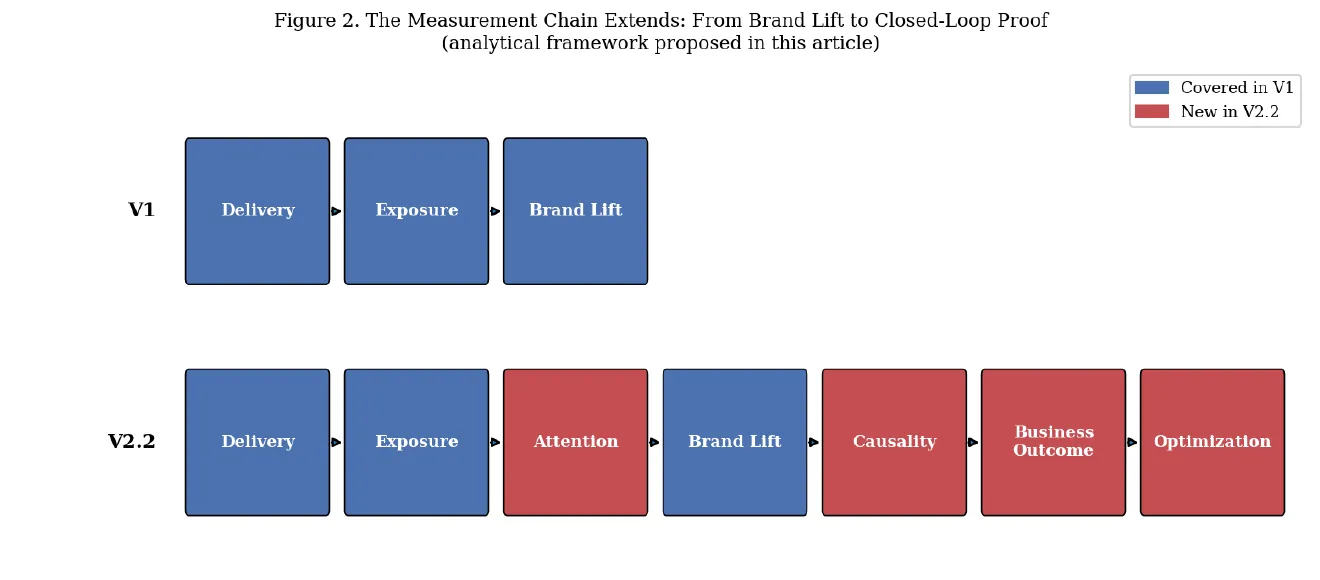
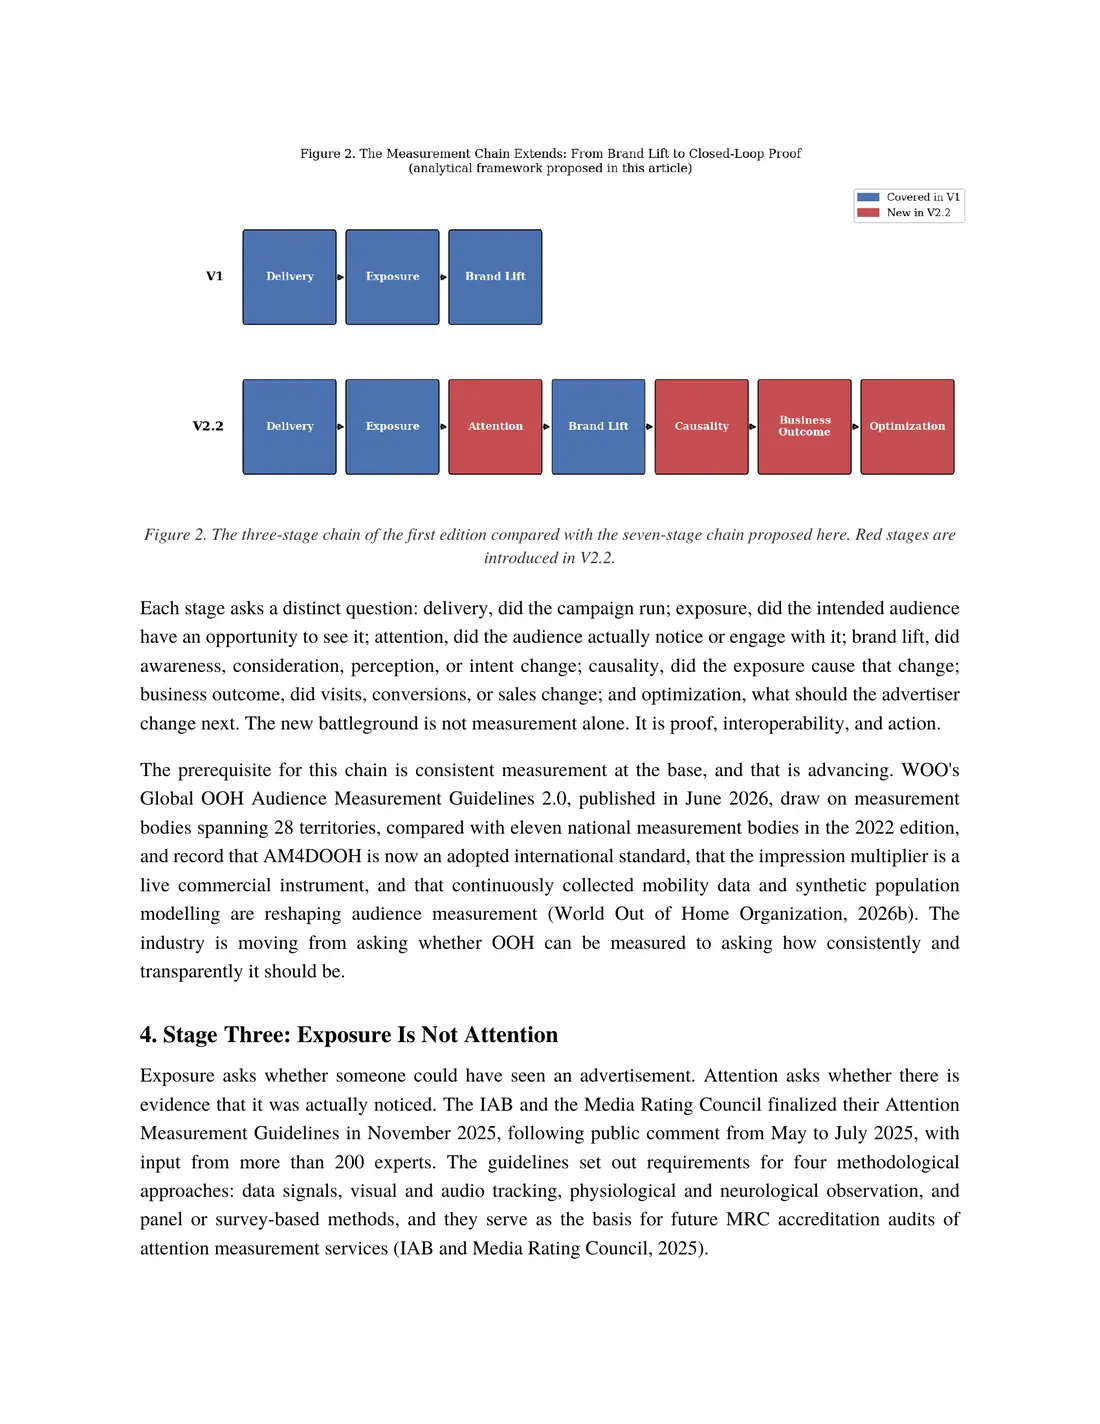
The first edition organized measurement around delivery, exposure, and brand lift. That chain answers whether a campaign ran, whether an audience could have seen it, and whether brand metrics moved. It does not answer whether anyone actually noticed the advertisement, whether the advertisement caused the change observed, whether that change reached business behaviour, or whether the evidence can alter a campaign while it is still running. This article therefore proposes a seven-stage chain, presented in Figure 2.
Figure 2. The three-stage chain of the first edition compared with the seven-stage chain proposed here. Red stages are introduced in V2.2.
Each stage asks a distinct question: delivery, did the campaign run; exposure, did the intended audience have an opportunity to see it; attention, did the audience actually notice or engage with it; brand lift, did awareness, consideration, perception, or intent change; causality, did the exposure cause that change; business outcome, did visits, conversions, or sales change; and optimization, what should the advertiser change next. The new battleground is not measurement alone. It is proof, interoperability, and action.
The prerequisite for this chain is consistent measurement at the base, and that is advancing. WOO's Global OOH Audience Measurement Guidelines 2.0, published in June 2026, draw on measurement bodies spanning 28 territories, compared with eleven national measurement bodies in the 2022 edition, and record that AM4DOOH is now an adopted international standard, that the impression multiplier is a live commercial instrument, and that continuously collected mobility data and synthetic population modelling are reshaping audience measurement (World Out of Home Organization, 2026b). The industry is moving from asking whether OOH can be measured to asking how consistently and transparently it should be.
4. Stage Three: Exposure Is Not Attention
Exposure asks whether someone could have seen an advertisement. Attention asks whether there is evidence that it was actually noticed. The IAB and the Media Rating Council finalized their Attention Measurement Guidelines in November 2025, following public comment from May to July 2025, with input from more than 200 experts. The guidelines set out requirements for four methodological approaches: data signals, visual and audio tracking, physiological and neurological observation, and panel or survey-based methods, and they serve as the basis for future MRC accreditation audits of attention measurement services (IAB and Media Rating Council, 2025).
The guidelines frame attention as a complement to existing measurement rather than a replacement for other key performance indicators. This article adopts the same position and adds a second distinction: attention is not an outcome. A noticed advertisement that changes nothing has not created value. The relevant formulation is therefore two-sided.
Exposure is not attention. Attention is not outcome.
5. Stage Four: Brand Lift Remains Essential, but It Is Not the Destination
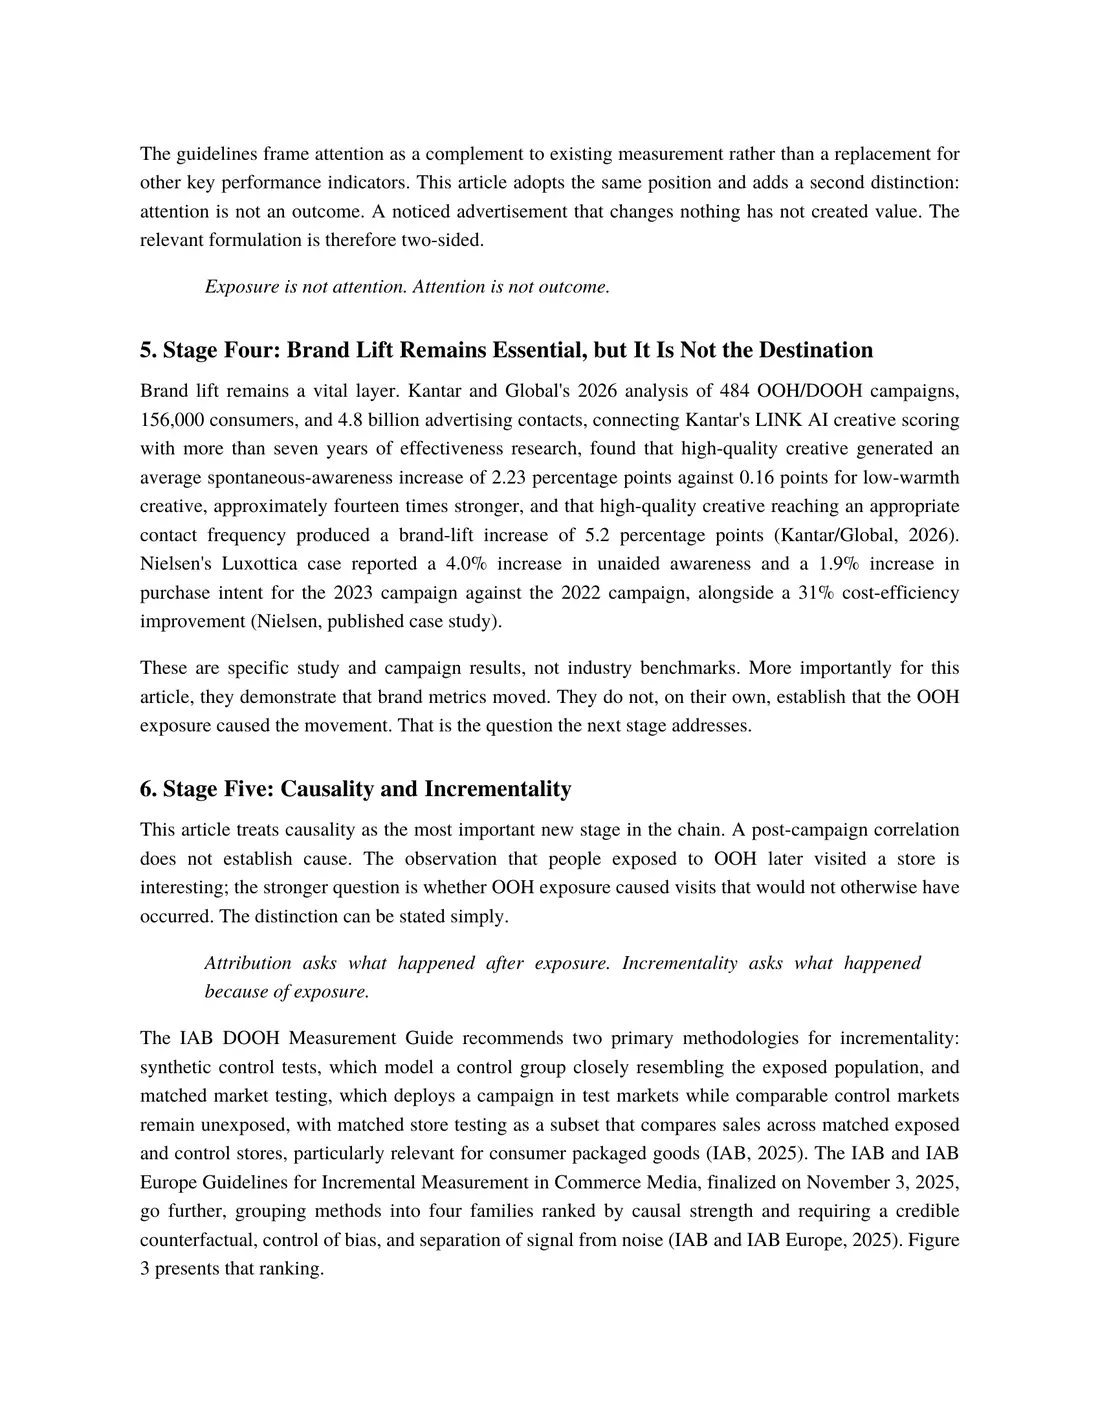
Brand lift remains a vital layer. Kantar and Global's 2026 analysis of 484 OOH/DOOH campaigns, 156,000 consumers, and 4.8 billion advertising contacts, connecting Kantar's LINK AI creative scoring with more than seven years of effectiveness research, found that high-quality creative generated an average spontaneous-awareness increase of 2.23 percentage points against 0.16 points for low-warmth creative, approximately fourteen times stronger, and that high-quality creative reaching an appropriate contact frequency produced a brand-lift increase of 5.2 percentage points (Kantar/Global, 2026). Nielsen's Luxottica case reported a 4.0% increase in unaided awareness and a 1.9% increase in purchase intent for the 2023 campaign against the 2022 campaign, alongside a 31% cost-efficiency improvement (Nielsen, published case study).
These are specific study and campaign results, not industry benchmarks. More importantly for this article, they demonstrate that brand metrics moved. They do not, on their own, establish that the OOH exposure caused the movement. That is the question the next stage addresses.
6. Stage Five: Causality and Incrementality
This article treats causality as the most important new stage in the chain. A post-campaign correlation does not establish cause. The observation that people exposed to OOH later visited a store is interesting; the stronger question is whether OOH exposure caused visits that would not otherwise have occurred. The distinction can be stated simply.
Attribution asks what happened after exposure. Incrementality asks what happened because of exposure.
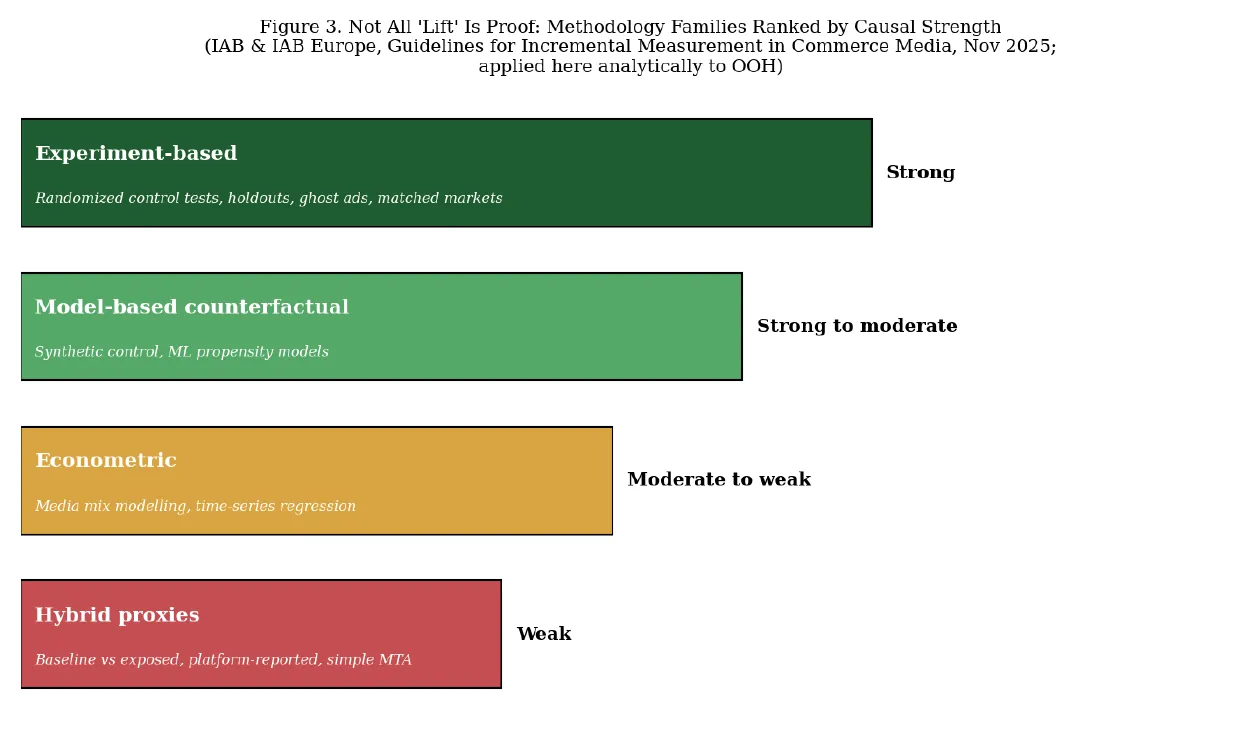
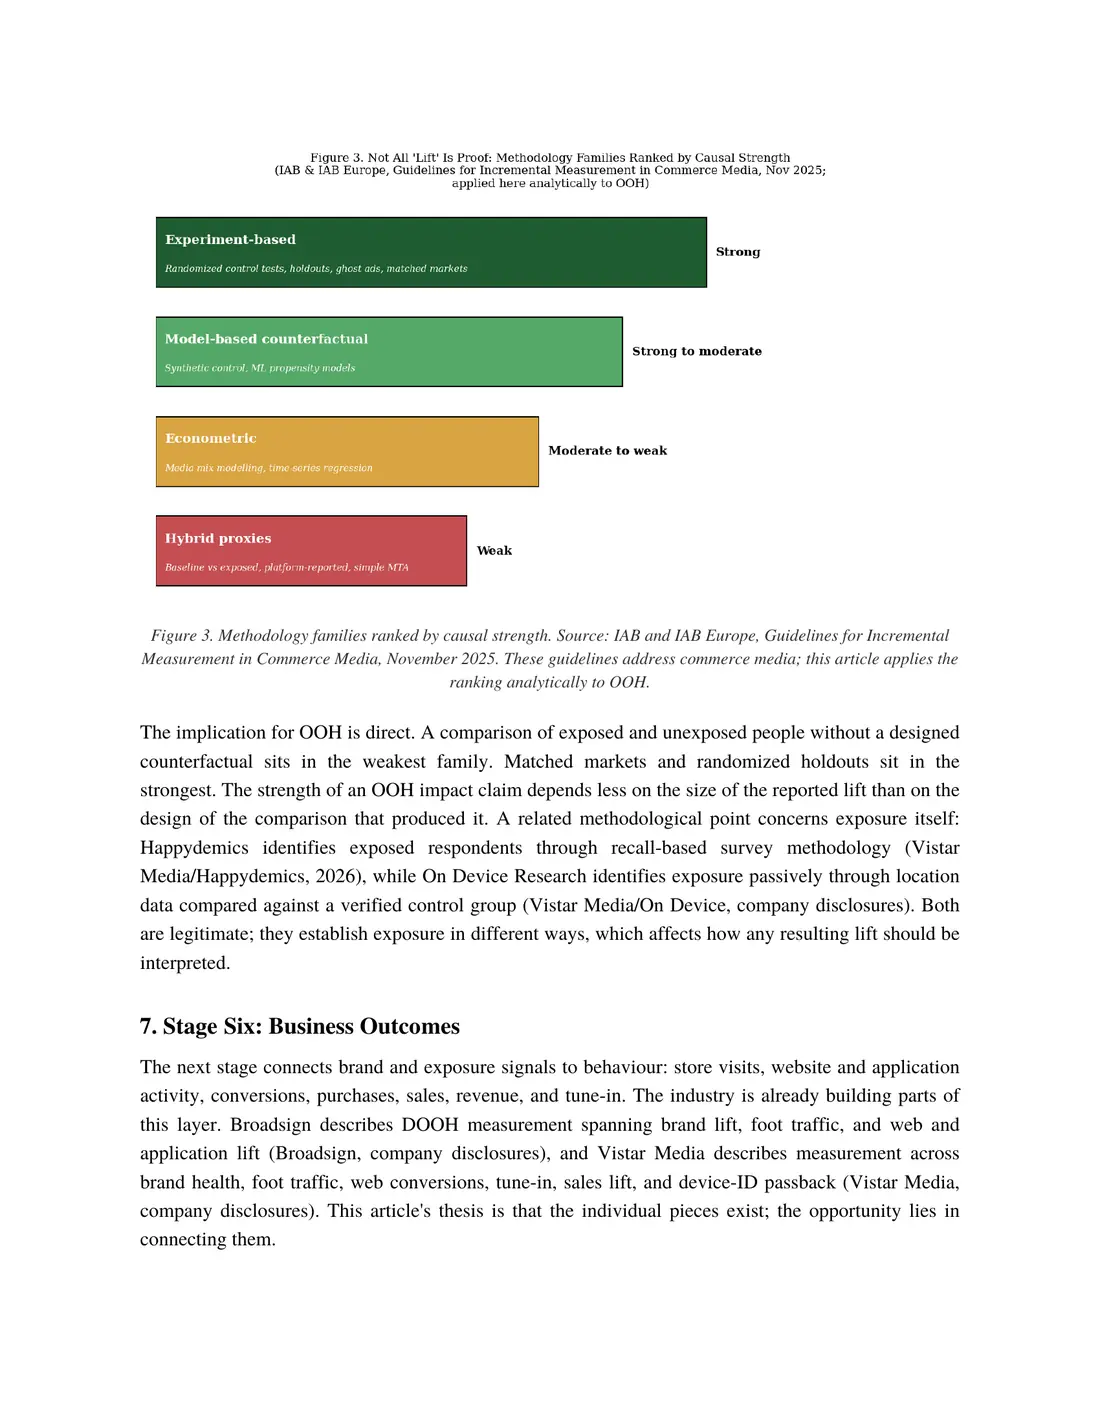
The IAB DOOH Measurement Guide recommends two primary methodologies for incrementality: synthetic control tests, which model a control group closely resembling the exposed population, and matched market testing, which deploys a campaign in test markets while comparable control markets remain unexposed, with matched store testing as a subset that compares sales across matched exposed and control stores, particularly relevant for consumer packaged goods (IAB, 2025). The IAB and IAB Europe Guidelines for Incremental Measurement in Commerce Media, finalized on November 3, 2025, go further, grouping methods into four families ranked by causal strength and requiring a credible counterfactual, control of bias, and separation of signal from noise (IAB and IAB Europe, 2025). Figure 3 presents that ranking.
Figure 3. Methodology families ranked by causal strength. Source: IAB and IAB Europe, Guidelines for Incremental Measurement in Commerce Media, November 2025. These guidelines address commerce media; this article applies the ranking analytically to OOH.
The implication for OOH is direct. A comparison of exposed and unexposed people without a designed counterfactual sits in the weakest family. Matched markets and randomized holdouts sit in the strongest. The strength of an OOH impact claim depends less on the size of the reported lift than on the design of the comparison that produced it. A related methodological point concerns exposure itself: Happydemics identifies exposed respondents through recall-based survey methodology (Vistar Media/Happydemics, 2026), while On Device Research identifies exposure passively through location data compared against a verified control group (Vistar Media/On Device, company disclosures). Both are legitimate; they establish exposure in different ways, which affects how any resulting lift should be interpreted.
7. Stage Six: Business Outcomes
The next stage connects brand and exposure signals to behaviour: store visits, website and application activity, conversions, purchases, sales, revenue, and tune-in. The industry is already building parts of this layer. Broadsign describes DOOH measurement spanning brand lift, foot traffic, and web and application lift (Broadsign, company disclosures), and Vistar Media describes measurement across brand health, foot traffic, web conversions, tune-in, sales lift, and device-ID passback (Vistar Media, company disclosures). This article's thesis is that the individual pieces exist; the opportunity lies in connecting them.
8. Stage Seven: Measurement Becomes an Optimization Signal
Traditional measurement runs from campaign, to measurement, to report. The emerging model runs from campaign, to measurement, to decision, to optimization, to the next campaign. Nielsen's Predictive Sales Lift, announced on April 27, 2026, illustrates the direction: it predicts sales lift and incremental revenue for campaigns on its Nielsen ONE Ads platform, modelled on sales lift results from hundreds of historical campaigns, and is positioned as a directional, in-flight signal for mid-campaign optimization rather than a replacement for full sales lift studies (Nielsen, 2026). Nielsen noted that its conventional sales lift studies typically cost 25,000 to 50,000 dollars per campaign, which the predictive approach is intended to undercut (AdExchanger, 2026).
This article records an important boundary. Predictive Sales Lift is currently available only in the United States and only for digital and connected-television campaigns; it is not an OOH product (Research Live, 2026). It is cited here as evidence of where measurement is heading across media, not as documented OOH capability. The underlying change is nevertheless significant: measurement is no longer necessarily the endpoint of a campaign. It can become an input to the next decision.
9. Artificial Intelligence as a Reasoning Layer, Not a Substitute
This article does not position artificial intelligence as a solution in itself. The credible model runs from data, to measurement, to causal evidence, to AI reasoning, to decision, to optimization. Beneath the AI layer must sit reliable exposure data, standardized definitions, validated measurement, causal methodology, privacy-safe data infrastructure, deterministic optimization rules, and clean outcome data. AI applied to weak exposure data, inconsistent definitions, or non-causal comparisons can produce confident but unreliable conclusions. The article's position is AI on top of validated measurement, not instead of it.
10. The Player Landscape: Who Owns Which Part of the Chain
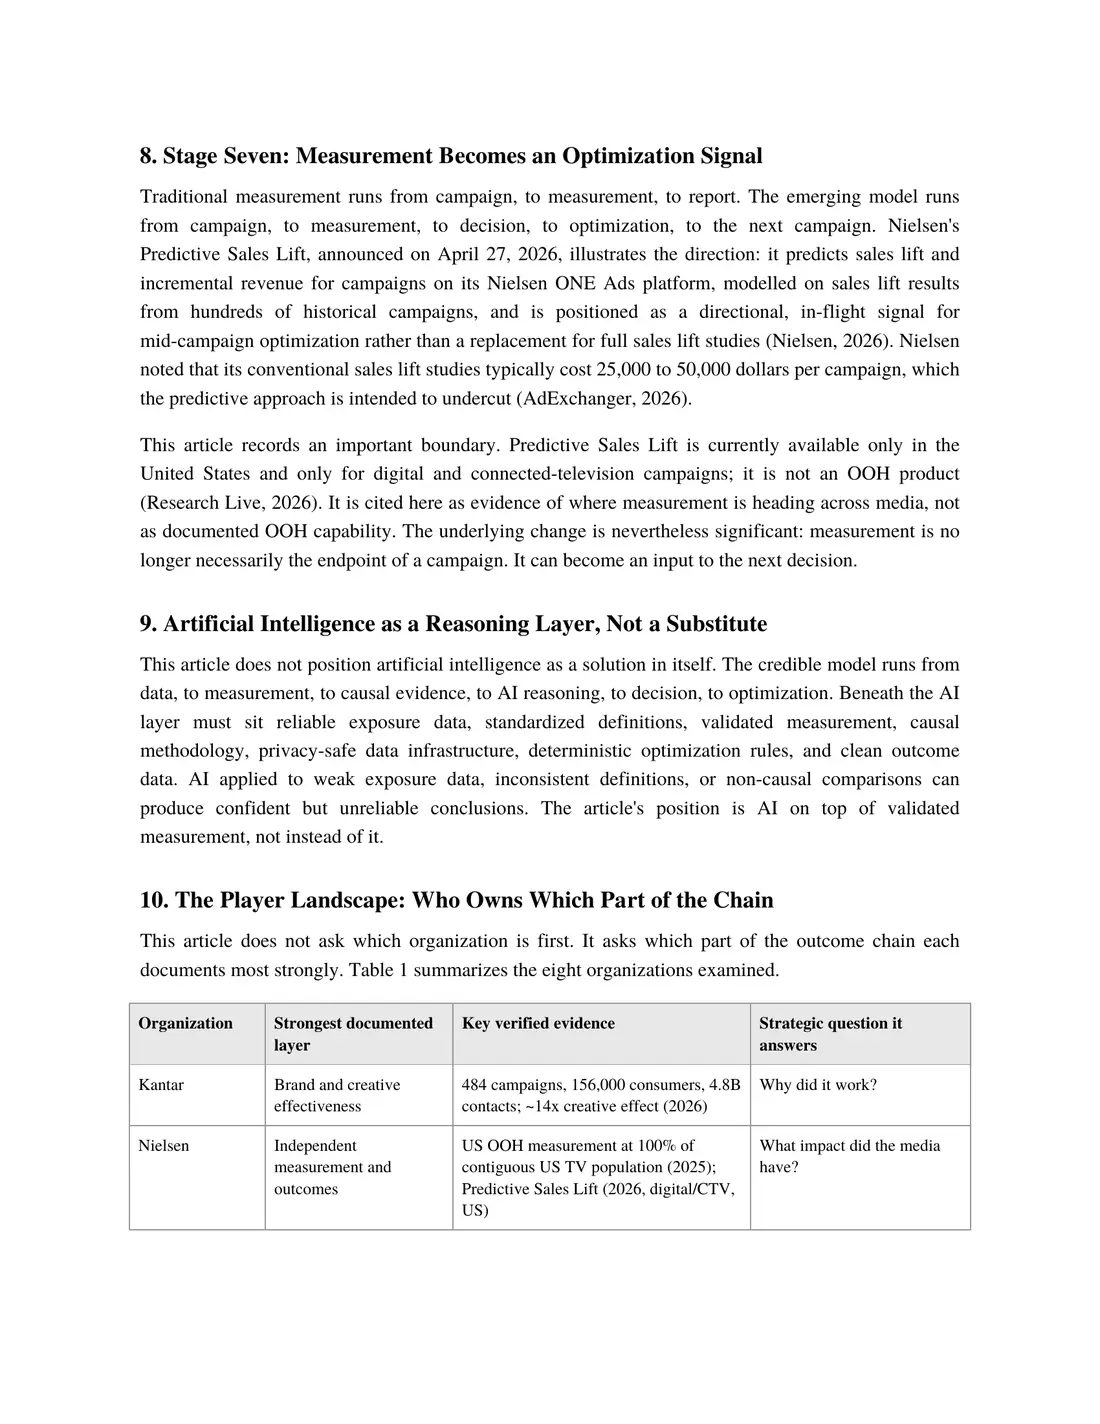
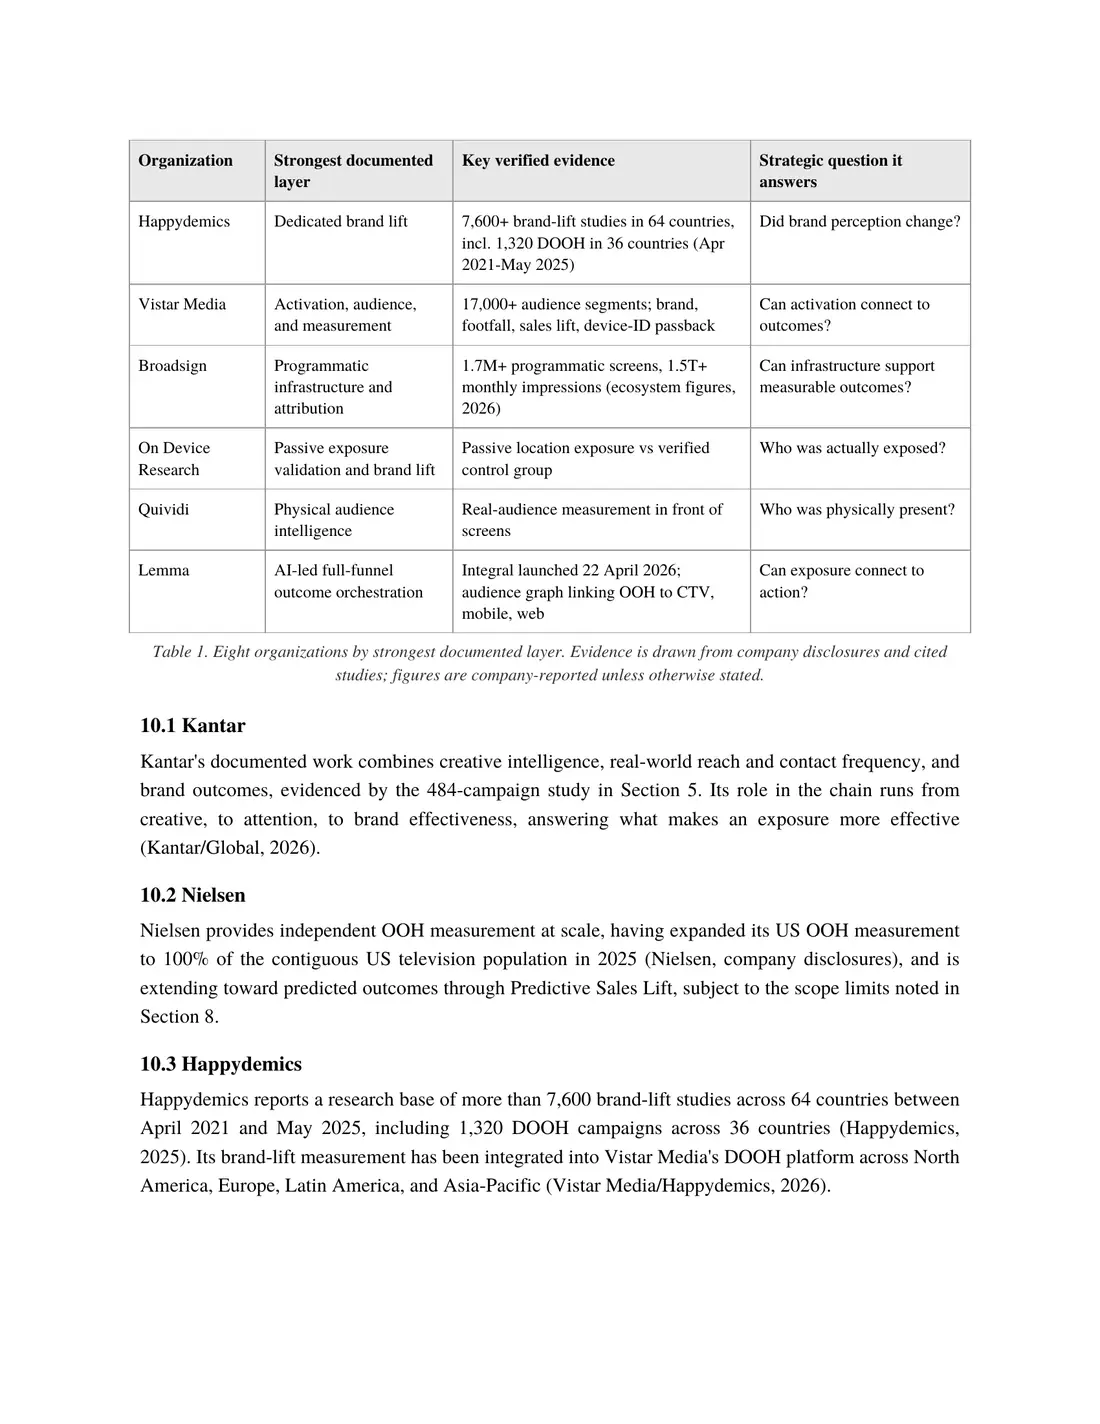
This article does not ask which organization is first. It asks which part of the outcome chain each documents most strongly. Table 1 summarizes the eight organizations examined.
Table 1. Eight organizations by strongest documented layer. Evidence is drawn from company disclosures and cited studies; figures are company-reported unless otherwise stated.
Passive location exposure vs verified control group
Who was actually exposed?
Quividi
Physical audience intelligence
Real-audience measurement in front of screens
Who was physically present?
Lemma
AI-led full-funnel outcome orchestration
Integral launched 22 April 2026; audience graph linking OOH to CTV, mobile, web
Can exposure connect to action?
10.1 Kantar
Kantar's documented work combines creative intelligence, real-world reach and contact frequency, and brand outcomes, evidenced by the 484-campaign study in Section 5. Its role in the chain runs from creative, to attention, to brand effectiveness, answering what makes an exposure more effective (Kantar/Global, 2026).
10.2 Nielsen
Nielsen provides independent OOH measurement at scale, having expanded its US OOH measurement to 100% of the contiguous US television population in 2025 (Nielsen, company disclosures), and is extending toward predicted outcomes through Predictive Sales Lift, subject to the scope limits noted in Section 8.
10.3 Happydemics
Happydemics reports a research base of more than 7,600 brand-lift studies across 64 countries between April 2021 and May 2025, including 1,320 DOOH campaigns across 36 countries (Happydemics, 2025). Its brand-lift measurement has been integrated into Vistar Media's DOOH platform across North America, Europe, Latin America, and Asia-Pacific (Vistar Media/Happydemics, 2026).
10.4 Vistar Media and Broadsign
Vistar Media describes audience targeting across more than 17,000 segments connected to brand-lift and outcome measurement (Vistar Media, company disclosures). Broadsign's 2026 programmatic analysis of Broadsign and Place Exchange SSP data describes more than 1.7 million programmatically enabled screens and more than 1.5 trillion available impressions per month; these are ecosystem figures, not a measure of global OOH inventory (Broadsign, 2026). Both sit on the operational side of the loop.
10.5 On Device Research and Quividi
On Device Research's methodology, as documented in its Vistar partnership, uses passive location data to identify exposed audiences and compare them with a verified control group, measuring awareness, recall, consideration, and purchase intent, which makes it directly relevant to the causality stage. Quividi's VidiReports product measures real audiences in front of screens, placing its strength earlier in the chain, at the quality of exposure itself (Vistar Media/On Device, company disclosures; Quividi, company disclosures).
10.6 Lemma
Lemma launched Lemma Integral on April 22, 2026, describing it as an AI-first platform connecting OOH exposure to downstream digital engagement across connected television, mobile, and web through its proprietary Lemma Audience Graph, available across North America and Asia-Pacific (Lemma, 2026). Lemma describes the product as the industry's first full-funnel attribution platform; this article records that description as the company's own claim rather than independently validated market leadership.
11. The OOH Brand Lift Power Index 2.2
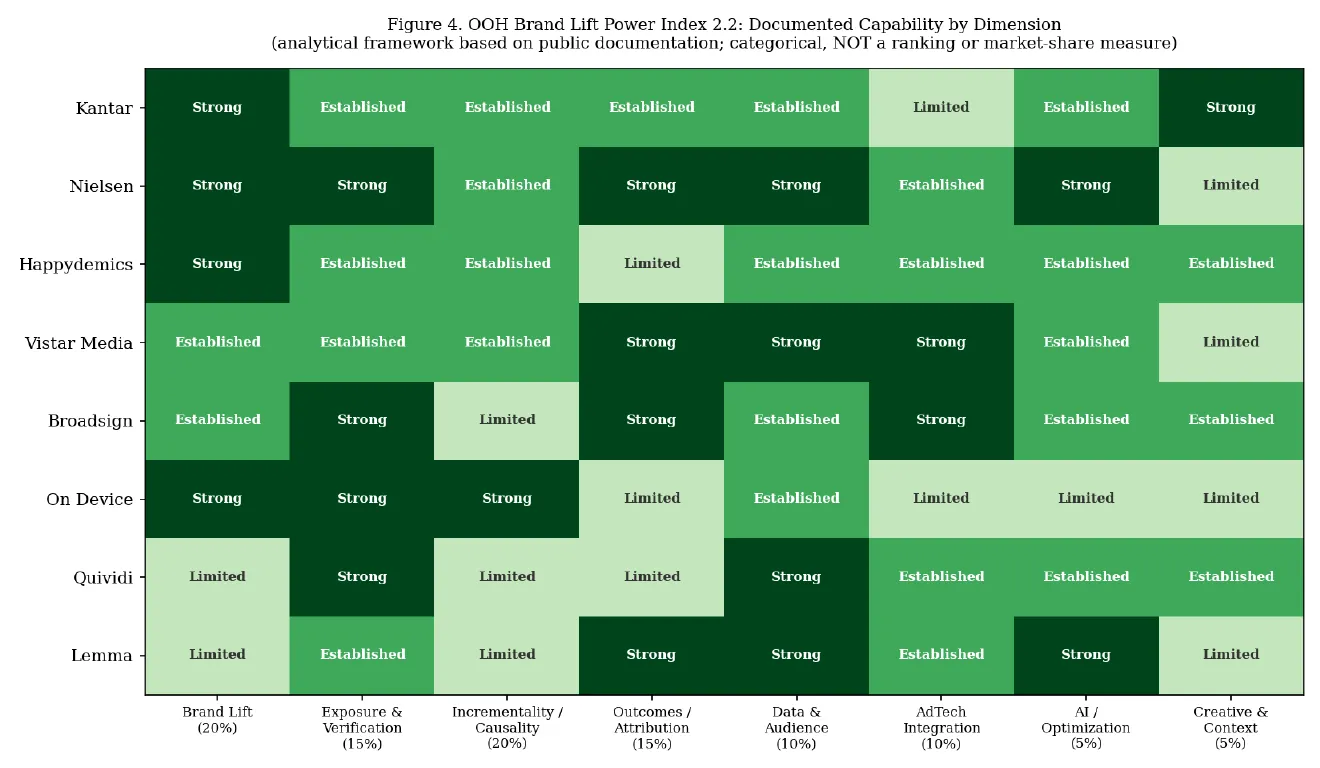
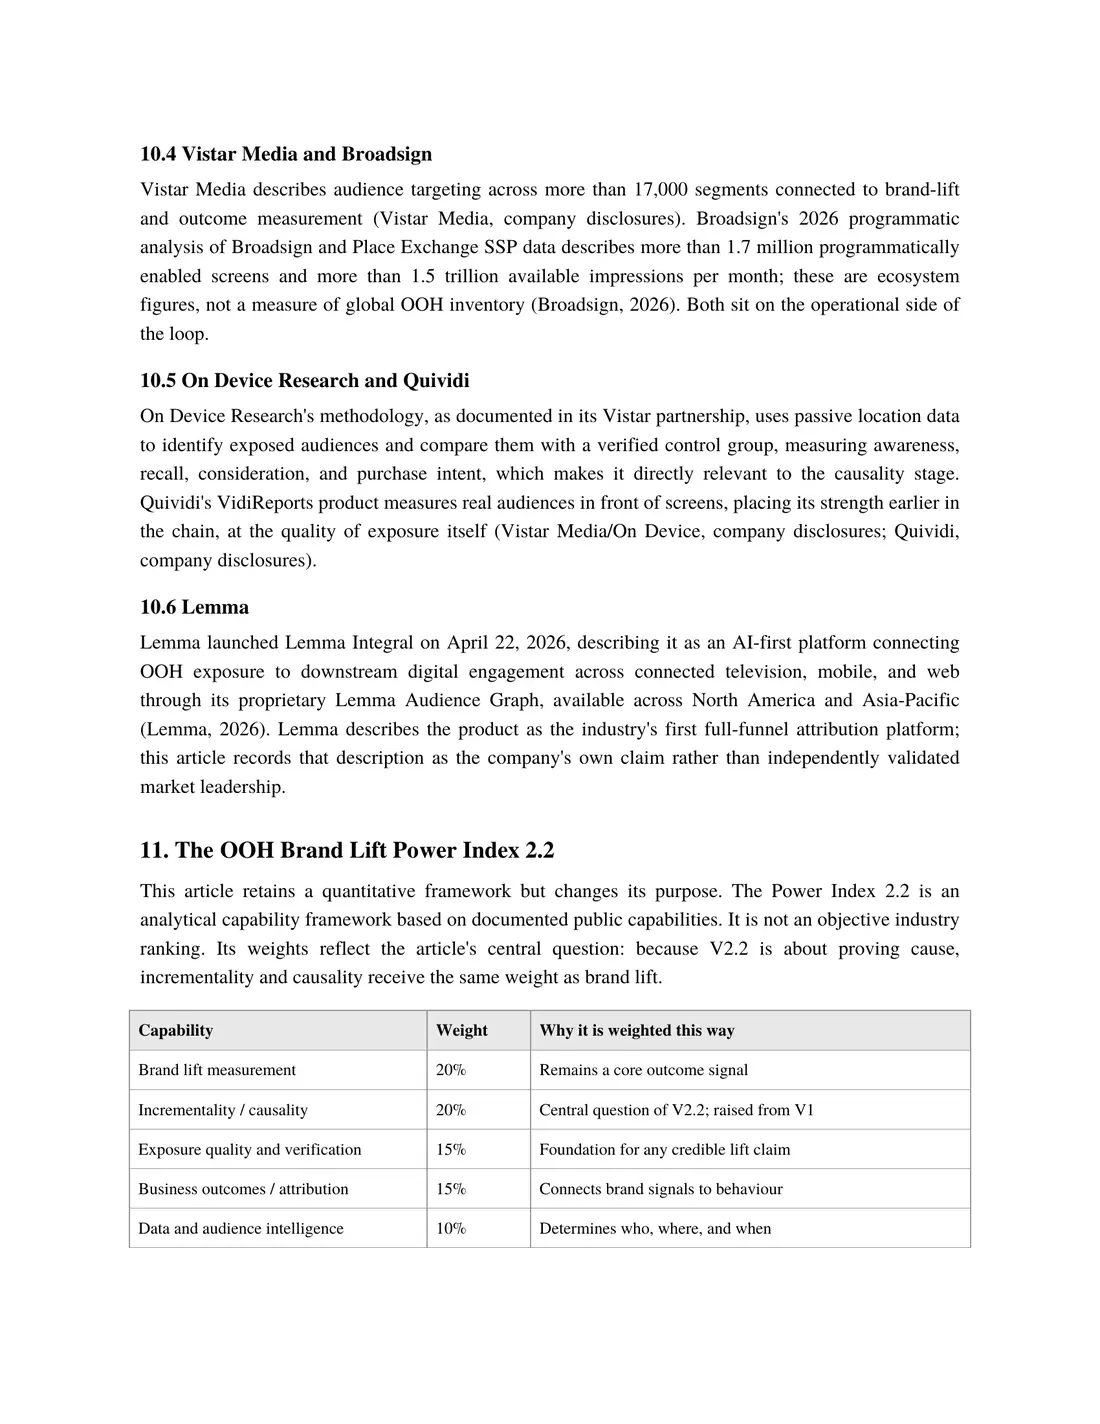
This article retains a quantitative framework but changes its purpose. The Power Index 2.2 is an analytical capability framework based on documented public capabilities. It is not an objective industry ranking. Its weights reflect the article's central question: because V2.2 is about proving cause, incrementality and causality receive the same weight as brand lift.
Table 2. Power Index 2.2 weighting.
Capability
Weight
Why it is weighted this way
Brand lift measurement
20%
Remains a core outcome signal
Incrementality / causality
20%
Central question of V2.2; raised from V1
Exposure quality and verification
15%
Foundation for any credible lift claim
Business outcomes / attribution
15%
Connects brand signals to behaviour
Data and audience intelligence
10%
Determines who, where, and when
AdTech integration
10%
Determines whether evidence can be acted upon
AI / optimization
5%
Valuable only on validated measurement
Creative and context intelligence
5%
Explains why exposure is effective
Total
100%
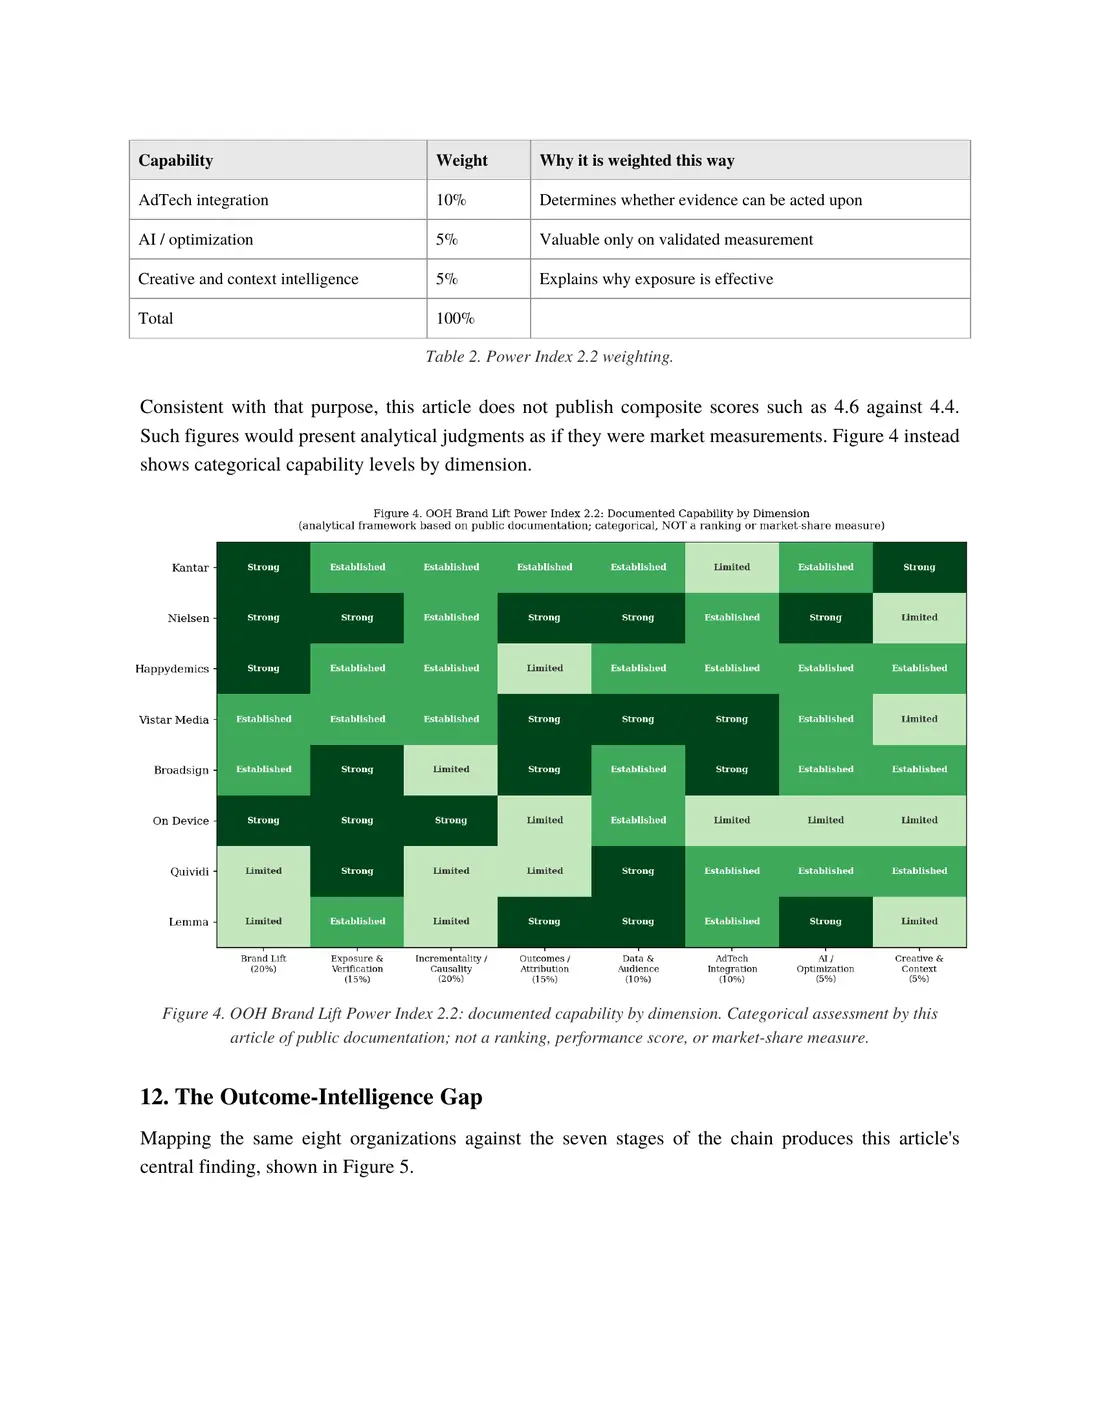
Consistent with that purpose, this article does not publish composite scores such as 4.6 against 4.4. Such figures would present analytical judgments as if they were market measurements. Figure 4 instead shows categorical capability levels by dimension.
Figure 4. OOH Brand Lift Power Index 2.2: documented capability by dimension. Categorical assessment by this article of public documentation; not a ranking, performance score, or market-share measure.
12. The Outcome-Intelligence Gap
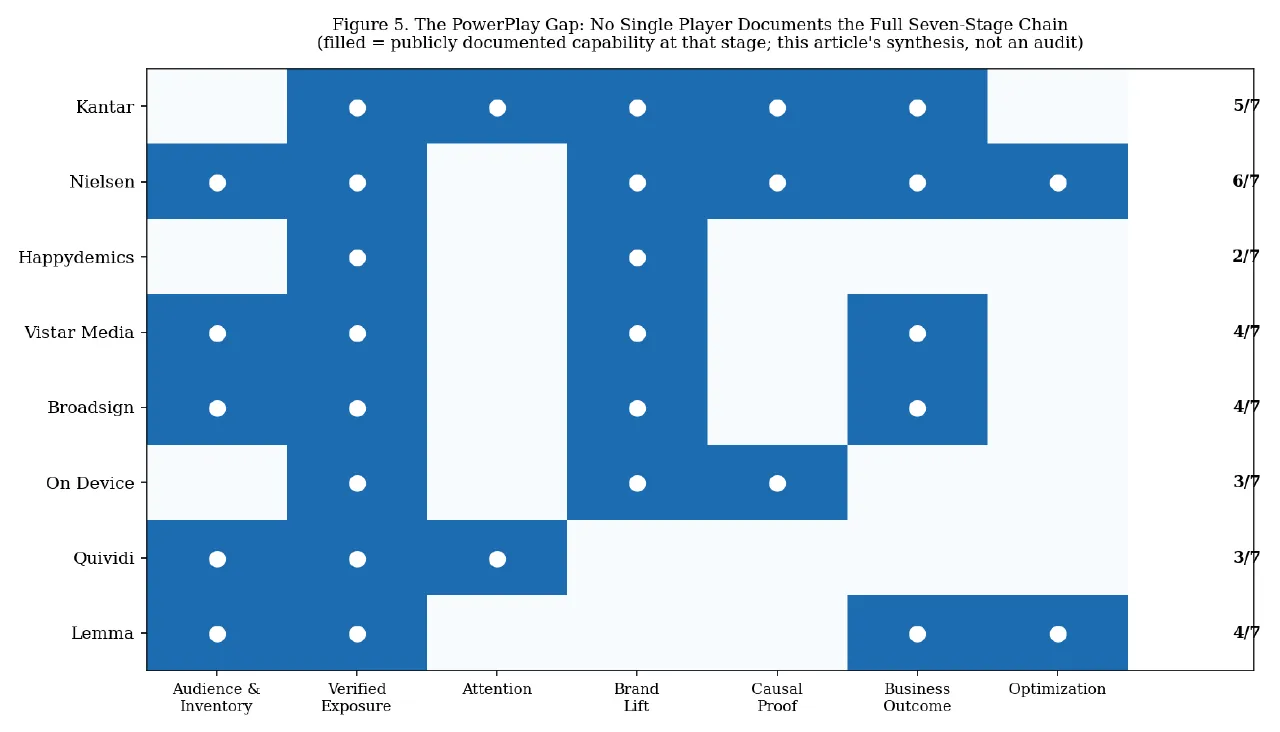
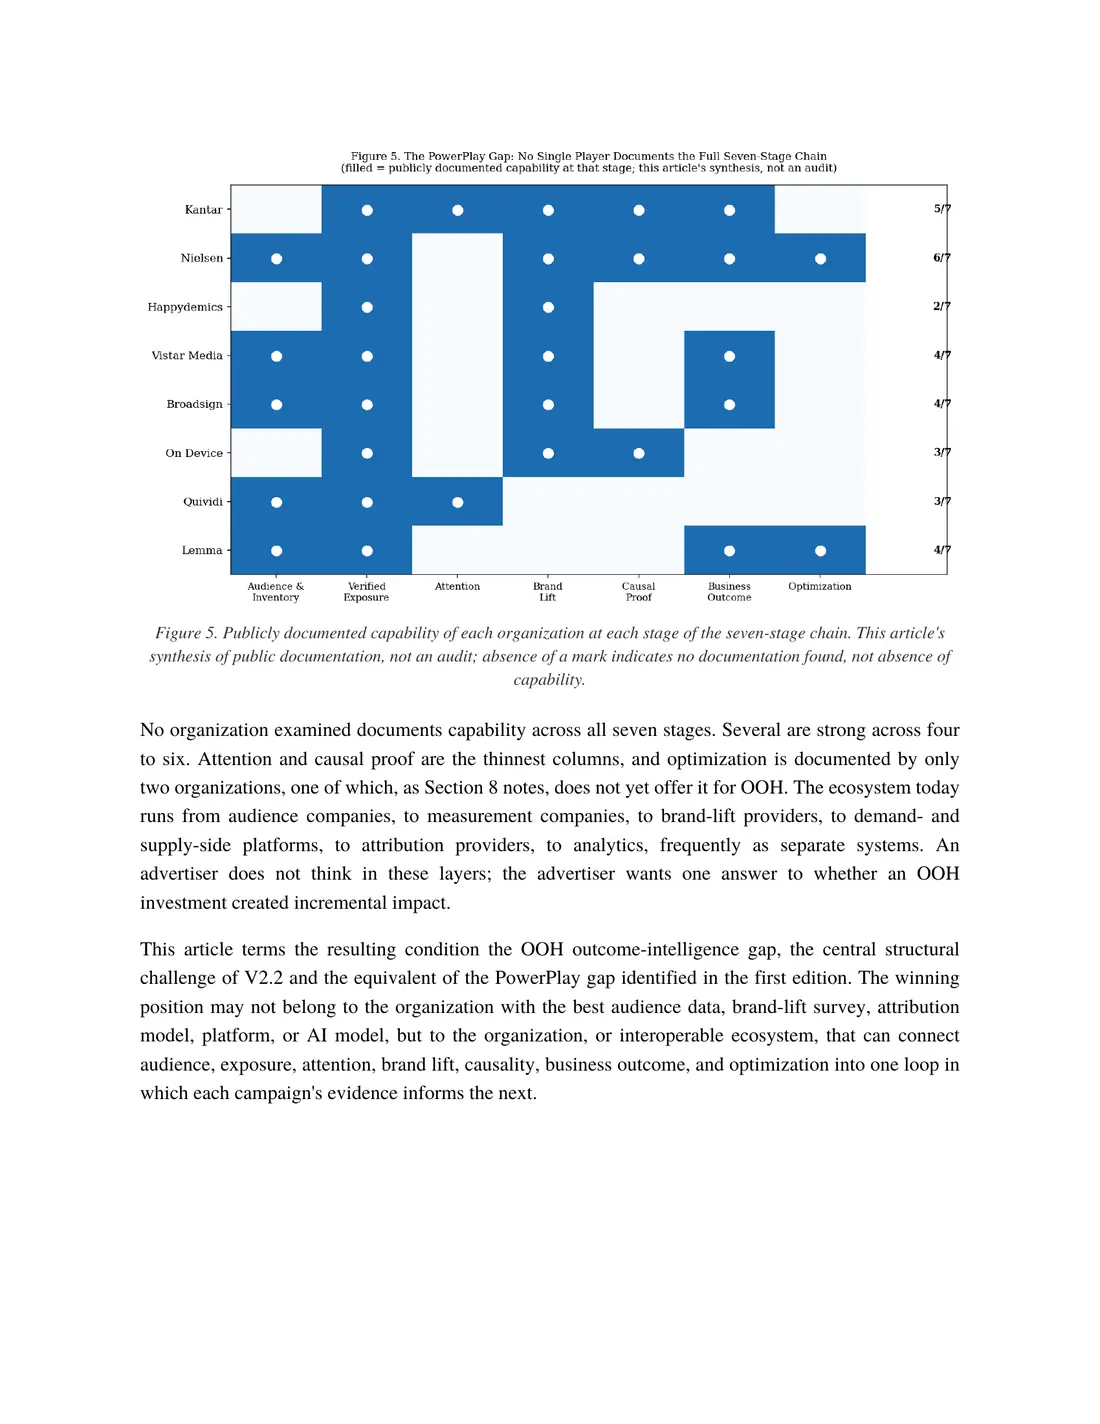
Mapping the same eight organizations against the seven stages of the chain produces this article's central finding, shown in Figure 5.
Figure 5. Publicly documented capability of each organization at each stage of the seven-stage chain. This article's synthesis of public documentation, not an audit; absence of a mark indicates no documentation found, not absence of capability.
No organization examined documents capability across all seven stages. Several are strong across four to six. Attention and causal proof are the thinnest columns, and optimization is documented by only two organizations, one of which, as Section 8 notes, does not yet offer it for OOH. The ecosystem today runs from audience companies, to measurement companies, to brand-lift providers, to demand- and supply-side platforms, to attribution providers, to analytics, frequently as separate systems. An advertiser does not think in these layers; the advertiser wants one answer to whether an OOH investment created incremental impact.
This article terms the resulting condition the OOH outcome-intelligence gap, the central structural challenge of V2.2 and the equivalent of the PowerPlay gap identified in the first edition. The winning position may not belong to the organization with the best audience data, brand-lift survey, attribution model, platform, or AI model, but to the organization, or interoperable ecosystem, that can connect audience, exposure, attention, brand lift, causality, business outcome, and optimization into one loop in which each campaign's evidence informs the next.
13. The Global View
The United States combines the largest pDOOH market by volume, 545.5 million dollars, with mature activation infrastructure and rising pressure for outcome evidence. Western Europe combines comparatively mature programmatic adoption, 346.7 million dollars at 21.3% penetration, with sophisticated national measurement systems. Eastern Asia represents the largest structural opportunity, with a 7.3 billion dollar DOOH base at 0.6% programmatic penetration, although its measurement environments differ substantially by market (World Out of Home Organization/PwC, 2026). Southeast Asia is treated here as a secondary expansion opportunity; the article's framework is global.
Independent forecasts point toward continued DOOH expansion, although estimates differ by methodology. WPP Media's December 2025 forecast projects DOOH growing from 22.2 billion dollars in 2025 to 31.4 billion dollars by 2030, 43.9% of OOH revenue (WPP Media, 2025). That forecast uses a different market definition from WOO's 25.5 billion dollar 2025 figure, and the two are not combined here.
14. A 2030 Strategic Scenario, Not a Market Forecast
This section is a scenario, labelled as such. The progression this article considers plausible runs from delivery in the early 2020s, to exposure in 2026, to brand impact in 2027-2028, to causal business impact in 2028-2029, to outcome intelligence by 2030, in which a system can predict a likely outcome and recommend the next decision. The value in this model moves upward. The lower layers, audience and inventory, verified exposure, attention, and brand lift, create evidence. The upper layers, causal proof, business outcome, and optimization, convert evidence into decisions.
15. Five Structural Problems
1 Exposure is not attention. An opportunity to see does not demonstrate that creative was noticed. The industry response is attention measurement as a complementary signal, now standardized by the IAB and MRC.
2 Brand lift is not causality. A change in awareness does not prove OOH caused it. The industry response is control groups, matched markets, and synthetic controls.
3 Attribution is not always incrementality. A visit after exposure does not mean the advertisement caused the visit. The industry response is a credible counterfactual.
4 Measurement is often still post-campaign. Evidence arriving after a campaign ends can inform the next one but cannot improve the current one. The industry response is in-flight measurement.
5 AI without measurement discipline is dangerous. It can turn weak data into confident conclusions. The response is AI on top of validated measurement, not instead of it.
16. Five Industry Moves
1 Standardize exposure: consistent, auditable definitions of exposure, impressions, visibility, opportunity-to-see, and frequency, building on WOO Guidelines 2.0.
2 Separate exposure from attention: treat attention as a distinct, complementary layer rather than equating it with opportunity-to-see.
3 Make incrementality routine for significant campaigns: use holdouts, matched markets, or synthetic controls, as the IAB DOOH Measurement Guide documents.
4 Connect brand and business outcomes: build interoperable data structures linking exposure, brand, behaviour, and business results rather than separate silos.
5 Make measurement actionable: move from dashboards to a loop of measurement, insight, decision, and optimization.
17. Limitations
This article is a strategic analysis, not an empirical study. The Power Index 2.2 and the chain-coverage mapping in Figures 4 and 5 are this article's categorical synthesis of public documentation; they are not audits, and the absence of documented capability does not establish that a capability does not exist. Company figures, including those of Vistar Media, Broadsign, Happydemics, Quividi, and Lemma, are company-reported. The WOO/PwC programmatic figures are indicative estimates aggregated but not audited by PwC. The IAB and IAB Europe causal-strength ranking was developed for commerce media and is applied to OOH analytically. Kantar, Nielsen, and Happydemics results are specific to the studies and campaigns cited and are not industry benchmarks; a specific optimal contact-frequency range attributed to Kantar's analysis in some commentary was not independently located and is not reported here. Nielsen's Predictive Sales Lift is not an OOH product. The 2030 section is a scenario, not a forecast. Figures should be verified against current primary sources before strategic or investment use.
18. Conclusion: From Exposure to Proof
The first edition of this analysis measured the players. This edition measures the proof. Its conclusion is that the next phase of competition in OOH will not be won by whoever measures the most, but by whoever can prove what caused an impact, connect that proof to business outcomes, and turn the evidence into the next media decision. OOH is moving from measurement to intelligence, from exposure to proof, and from reporting to optimization. The organizations examined in this article each hold real, documented strength in part of that journey. None yet holds all of it, and that gap is the opportunity.
Do not just measure the impression. Prove the impact. Optimize what happens next.