The US market's operating question is shifting from how many people passed a screen to who was exposed, who visited and whether behaviour changed. The paper examines eleven organisations across a five-layer data ecosystem and finds that the bigger opportunity is interoperability, not another dataset.
15.9%of US DOOH spend traded programmatically in 2025
Abstract
The physical billboard has never been the whole product. Behind a modern United States out-of-home (OOH) and digital out-of-home (DOOH) campaign sits a growing infrastructure of mobility signals, location intelligence, audience data, planning systems, demand- and supply-side platforms, measurement frameworks, and attribution technology. This article argues that the industry's central operating question is shifting from how many people passed a given screen toward who was likely exposed, who actually visited, whether the campaign influenced behaviour, and whether those signals can improve the next campaign. Drawing on the Out of Home Advertising Association of America's 2026 revenue reporting, the World Out of Home Organization's independently aggregated Global pDOOH Expenditure Study, and Geopath and OAAA's March 2026 selection of Ipsos to pilot a next-generation United States OOH audience measurement platform, this article documents a market generating 9.46 billion dollars in 2025, in which digital formats represent 36.3% of revenue and programmatic transaction represents only 15.9% of DOOH spend. The article proposes a five-layer data ecosystem model, moving from real-world signals through audience intelligence, planning and activation, measurement and attribution, to optimization and outcomes, and examines eleven organizations operating within that ecosystem, including Geopath, Ipsos, Foursquare, Veraset, Unacast, Precisely/PlaceIQ, Adsquare, Cuebiq, Placer.ai, Comscore, and Lumen Research. The article's central finding is that no single organization in this landscape currently spans the full chain from raw location signal to optimized business outcome; capability is distributed across specialists, and the article argues that the resulting interoperability gap, connecting fragmented signals into unified, actionable campaign intelligence, constitutes the more significant strategic opportunity than any single additional dataset.
Keywords
Out-of-Home Advertising
Digital Out-of-Home
Third-Party Data
Location Intelligence
Audience Measurement
Programmatic Advertising
Attribution
United States Advertising Market
Advertising Technology Standards
Data Interoperability
The full paper
Read the paper
The complete text, figures, tables and references, read here. Or see the original pages, or open the PDF.
1. Introduction: The Billboard Was Never Just a Billboard
A modern out-of-home (OOH) or digital out-of-home (DOOH) campaign in the United States sits atop a considerably larger infrastructure than the physical screen a consumer sees: mobility signals, location intelligence, audience data, planning systems, demand- and supply-side platforms, measurement frameworks, attribution technology, and, increasingly, artificial intelligence. This article's central argument is that the industry's defining operating question is shifting. The historical question, how many people passed the screen, is giving way to a more demanding sequence: who was likely exposed, who actually visited, whether the campaign influenced behaviour, and whether those signals can improve the next campaign. This article documents that shift specifically within the United States market, examining both the underlying market data and the organizations that supply, structure, and activate the data on which that shift depends.
This article proceeds as follows. Section 2 establishes the current state of the US OOH/DOOH market. Section 3 examines the industry's own effort to modernize audience measurement. Section 4 proposes a five-layer data ecosystem model. Section 5 presents a qualitative capability map across eleven organizations operating within that ecosystem, and Sections 6 through 16 examine each organization individually. Section 17 connects the ecosystem to the campaign lifecycle directly. Section 18 illustrates the shift from impressions to outcomes through worked examples across three verticals. Section 19 argues that interoperability, not any additional dataset, is the central strategic opportunity. Section 20 addresses the role of artificial intelligence, and Section 21 proposes a five-stage trajectory toward 2030. The article closes with its central thesis in Section 22.
2. The US Market Has Entered a New Measurement Phase
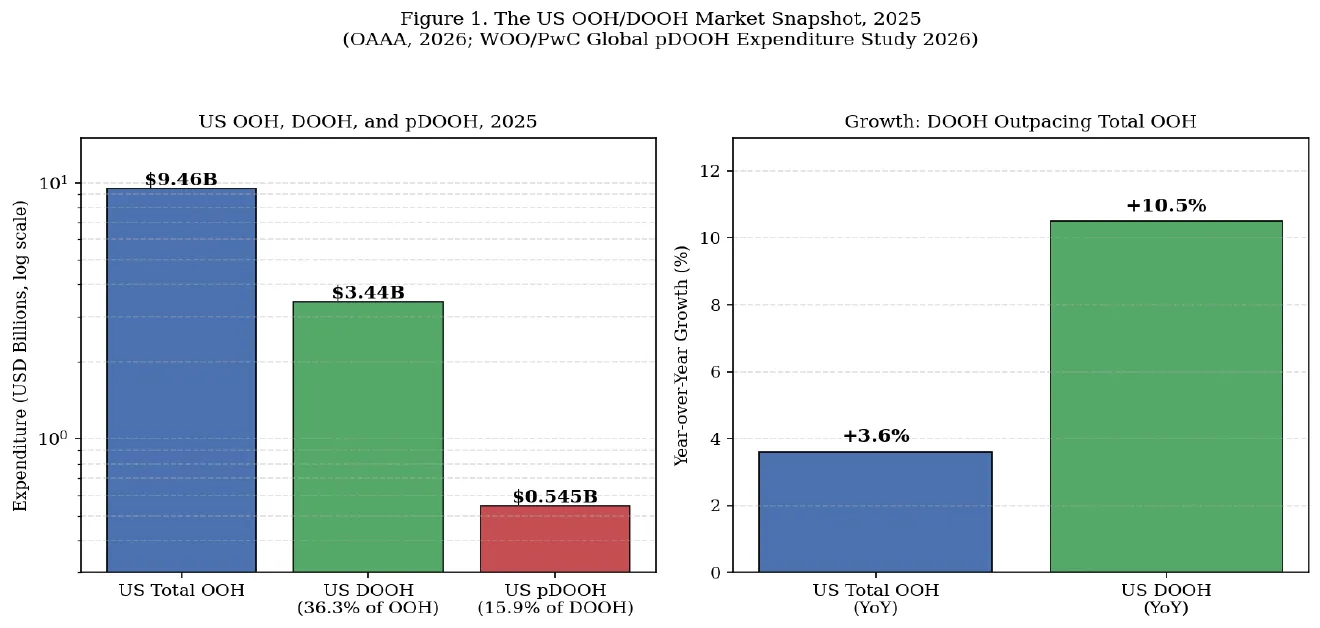
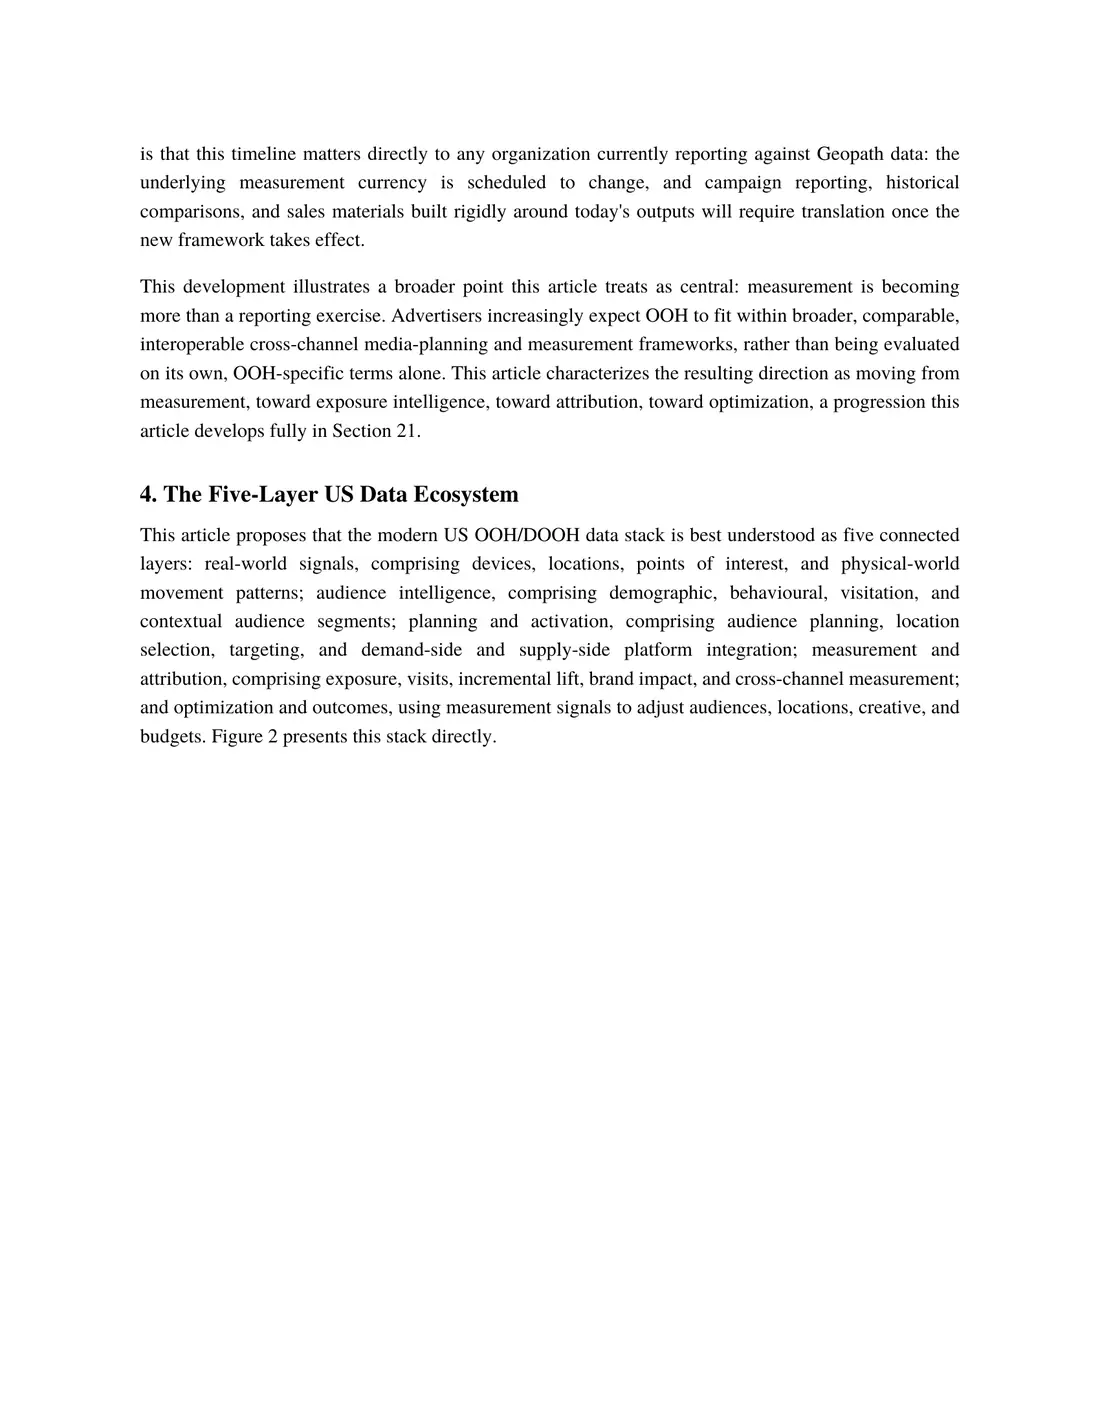
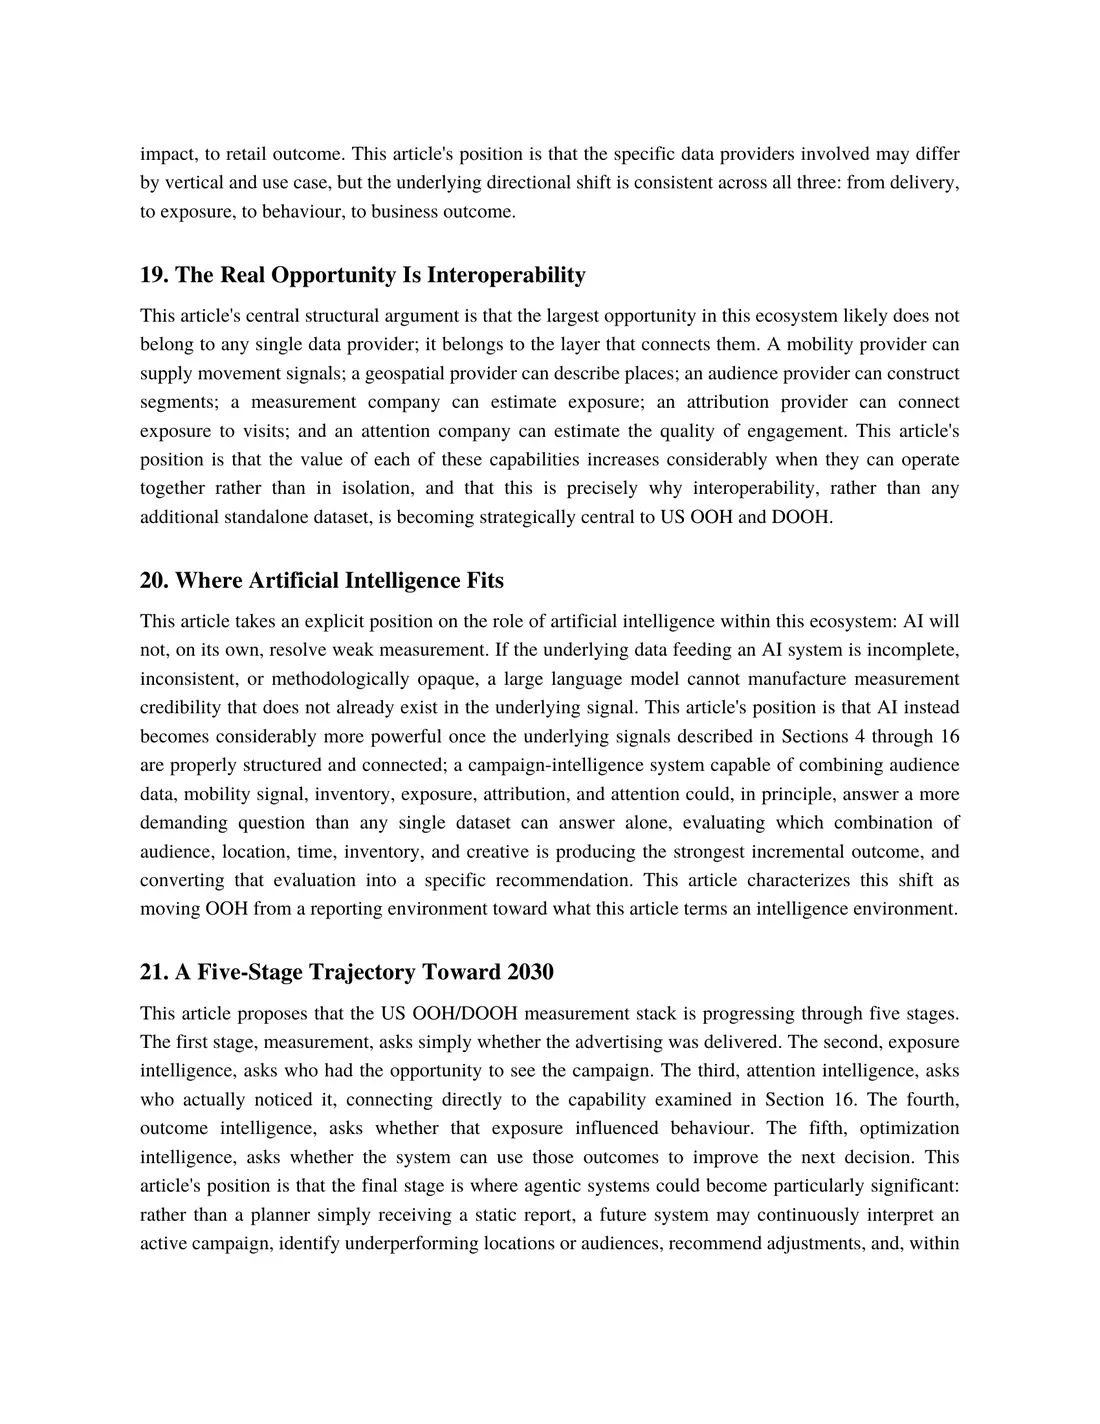
United States OOH advertising generated record revenue of 9.46 billion dollars in 2025, according to the Out of Home Advertising Association of America (OAAA), up 3.6% year over year; within that total, DOOH represented 36.3% of total US OOH revenue and grew 10.5% year over year, meaningfully outpacing the category's overall growth rate (OAAA, 2026a). Figure 1 presents this market snapshot directly.
Figure 1. Left panel: US total OOH, DOOH, and programmatic DOOH expenditure, 2025 (log scale). Right panel: year-over-year growth, US total OOH versus US DOOH specifically. Sources: OAAA, 2026a; World Out of Home Organization/PwC, 2026.
Programmatic DOOH is also becoming a meaningful, if still comparatively modest, part of the US digital OOH ecosystem. The inaugural WOO Global pDOOH Expenditure Study, independently aggregated by PricewaterhouseCoopers LLP from confidential revenue data submitted by twelve supply-side platforms across more than 40 markets, found that United States pDOOH expenditure reached 545.5 million dollars in 2025, the largest single pDOOH market globally by volume, representing 15.9% of US DOOH expenditure, a penetration rate that trails Germany's 31.8%, the highest among major markets in the study (World Out of Home Organization/PwC, 2026). This article's position is that the implication is significant: the US market is no longer asking only how to digitize OOH inventory. It is increasingly asking how to make that inventory measurable, addressable, attributable, and optimizable.
3. The Next-Generation Measurement Question
One of the most consequential 2026 developments in the US market is a coordinated, industry-wide effort to modernize OOH audience measurement itself. Geopath, in partnership with the OAAA, announced on March 31, 2026, following a 2025 needs assessment and a competitive request-for-proposal process, that Ipsos had been selected to support an industry pilot of a next-generation OOH measurement platform, launching in the second half of 2026 (Geopath/OAAA, 2026). The pilot will evaluate updated methods for estimating impressions, reach, and frequency across multiple OOH formats and environments; Geopath and OAAA anticipate an orderly transition from the current Geopath measurement system toward the next-generation framework beginning in 2027, with full industry adoption targeted for 2028 (Geopath/OAAA, 2026; Geopath, 2026). This article's position is that this timeline matters directly to any organization currently reporting against Geopath data: the underlying measurement currency is scheduled to change, and campaign reporting, historical comparisons, and sales materials built rigidly around today's outputs will require translation once the new framework takes effect.
This development illustrates a broader point this article treats as central: measurement is becoming more than a reporting exercise. Advertisers increasingly expect OOH to fit within broader, comparable, interoperable cross-channel media-planning and measurement frameworks, rather than being evaluated on its own, OOH-specific terms alone. This article characterizes the resulting direction as moving from measurement, toward exposure intelligence, toward attribution, toward optimization, a progression this article develops fully in Section 21.
4. The Five-Layer US Data Ecosystem
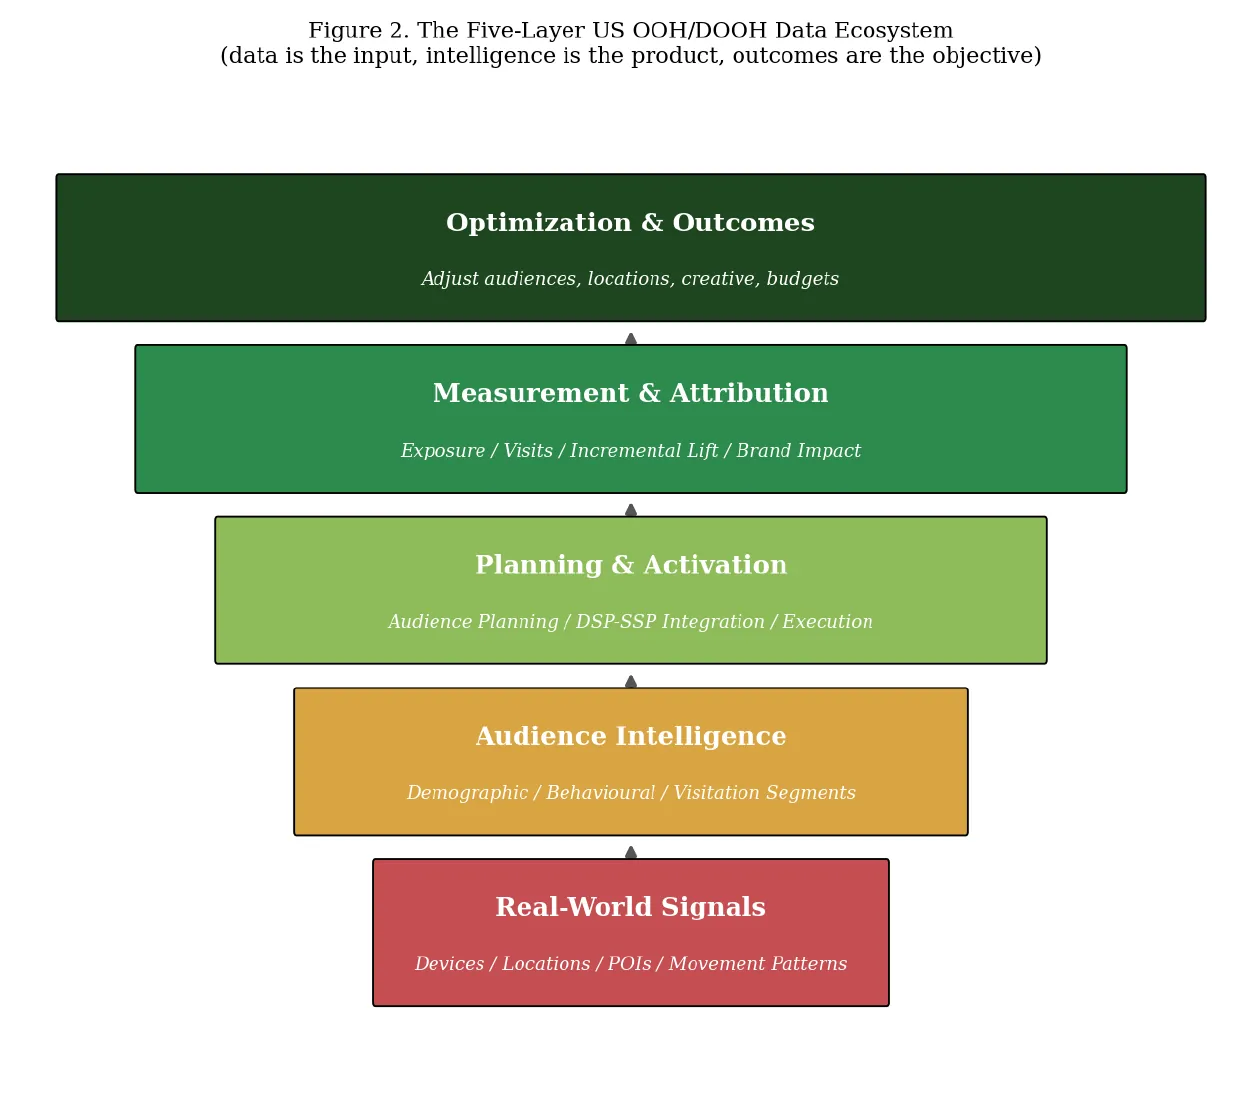
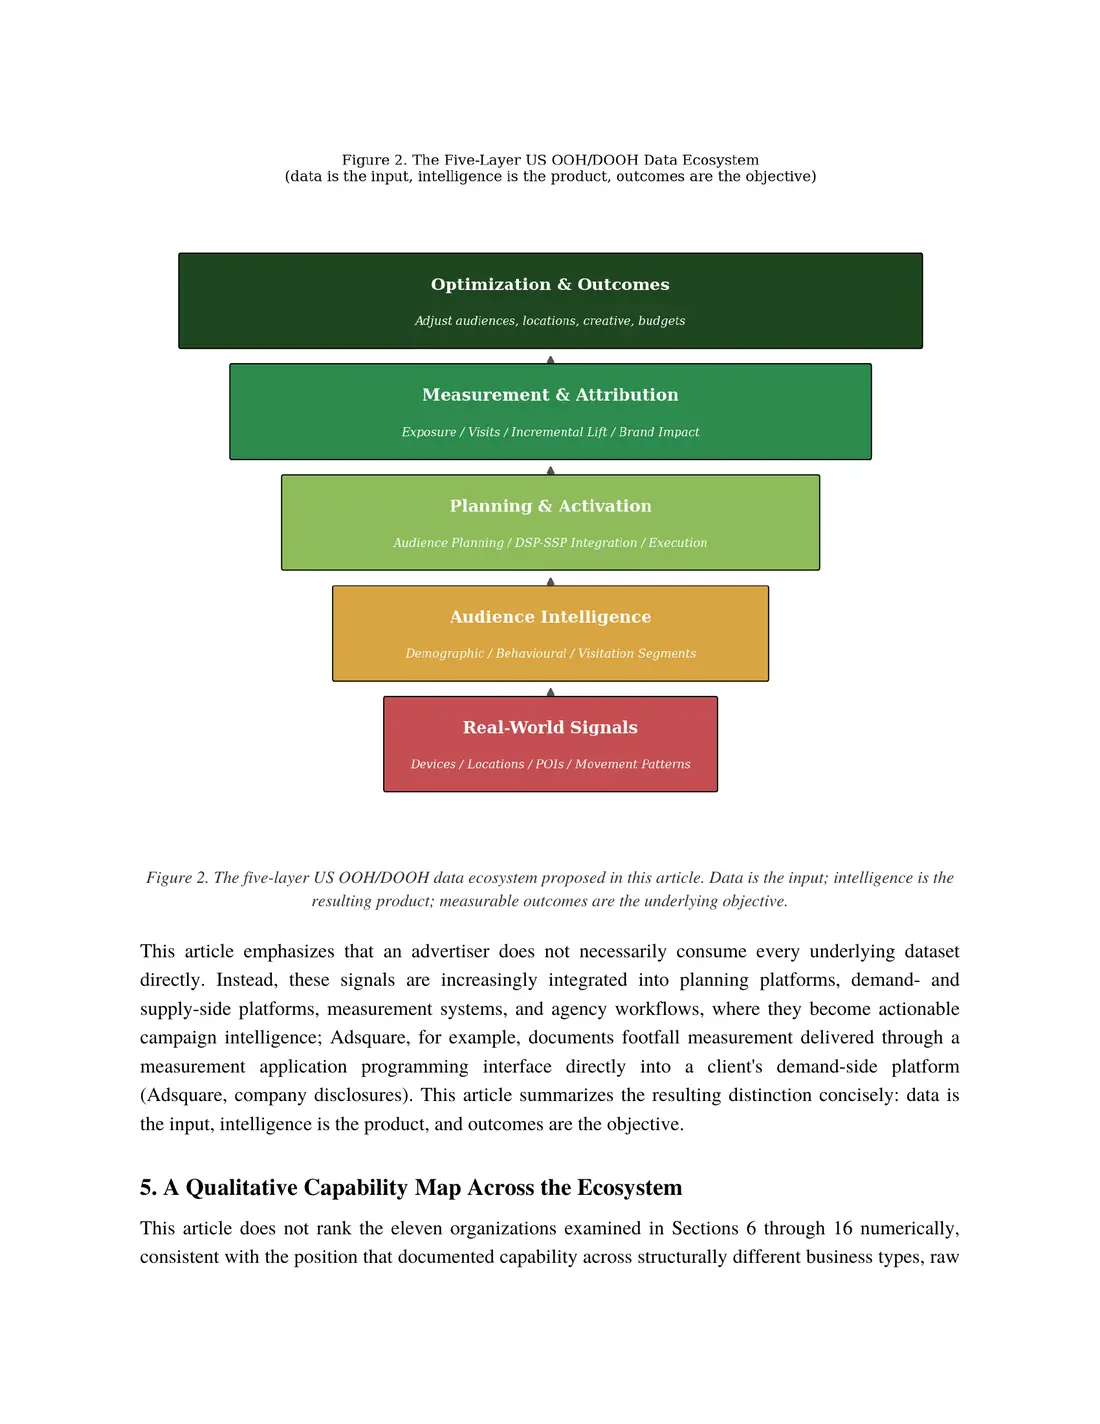
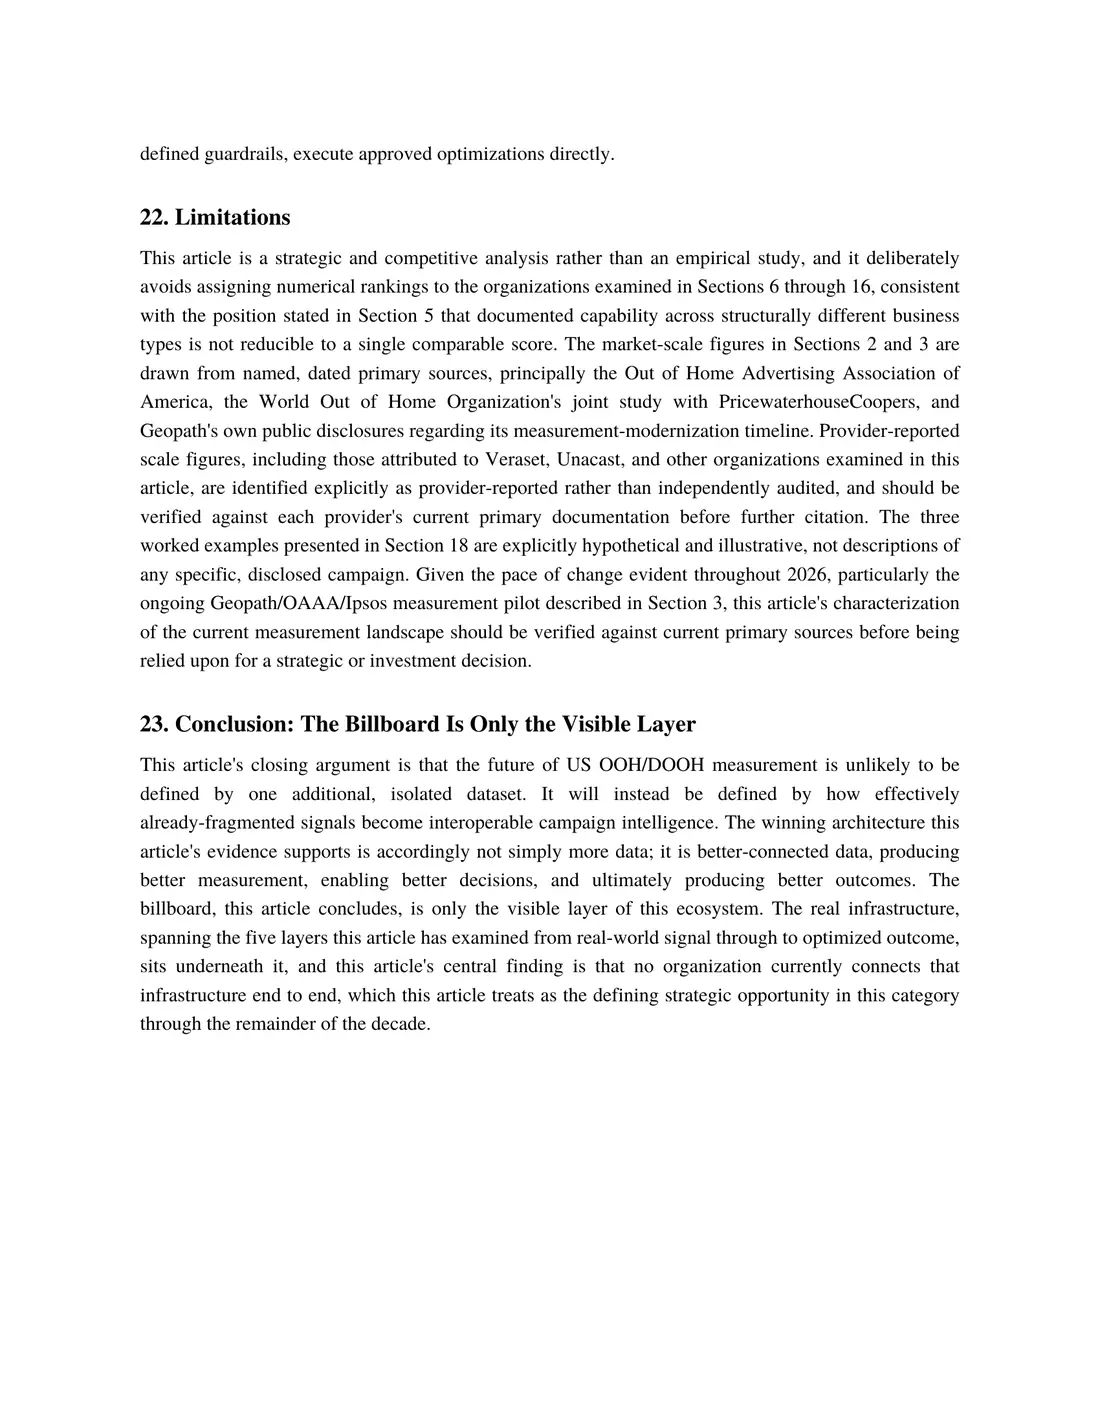
This article proposes that the modern US OOH/DOOH data stack is best understood as five connected layers: real-world signals, comprising devices, locations, points of interest, and physical-world movement patterns; audience intelligence, comprising demographic, behavioural, visitation, and contextual audience segments; planning and activation, comprising audience planning, location selection, targeting, and demand-side and supply-side platform integration; measurement and attribution, comprising exposure, visits, incremental lift, brand impact, and cross-channel measurement; and optimization and outcomes, using measurement signals to adjust audiences, locations, creative, and budgets. Figure 2 presents this stack directly.
Figure 2. The five-layer US OOH/DOOH data ecosystem proposed in this article. Data is the input; intelligence is the resulting product; measurable outcomes are the underlying objective.
This article emphasizes that an advertiser does not necessarily consume every underlying dataset directly. Instead, these signals are increasingly integrated into planning platforms, demand- and supply-side platforms, measurement systems, and agency workflows, where they become actionable campaign intelligence; Adsquare, for example, documents footfall measurement delivered through a measurement application programming interface directly into a client's demand-side platform (Adsquare, company disclosures). This article summarizes the resulting distinction concisely: data is the input, intelligence is the product, and outcomes are the objective.
5. A Qualitative Capability Map Across the Ecosystem
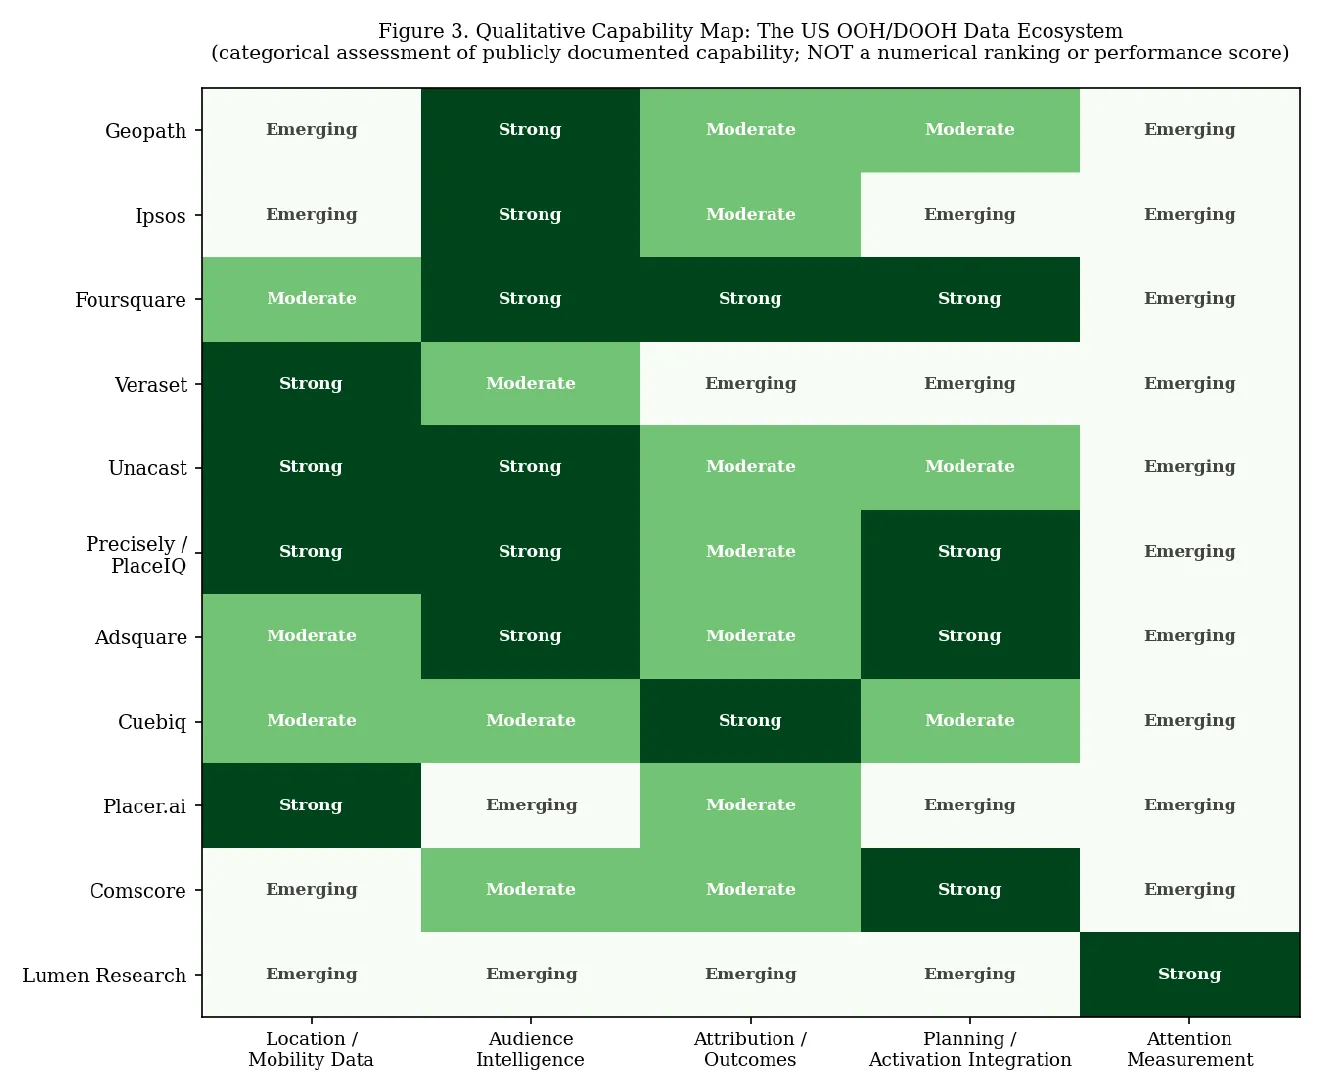
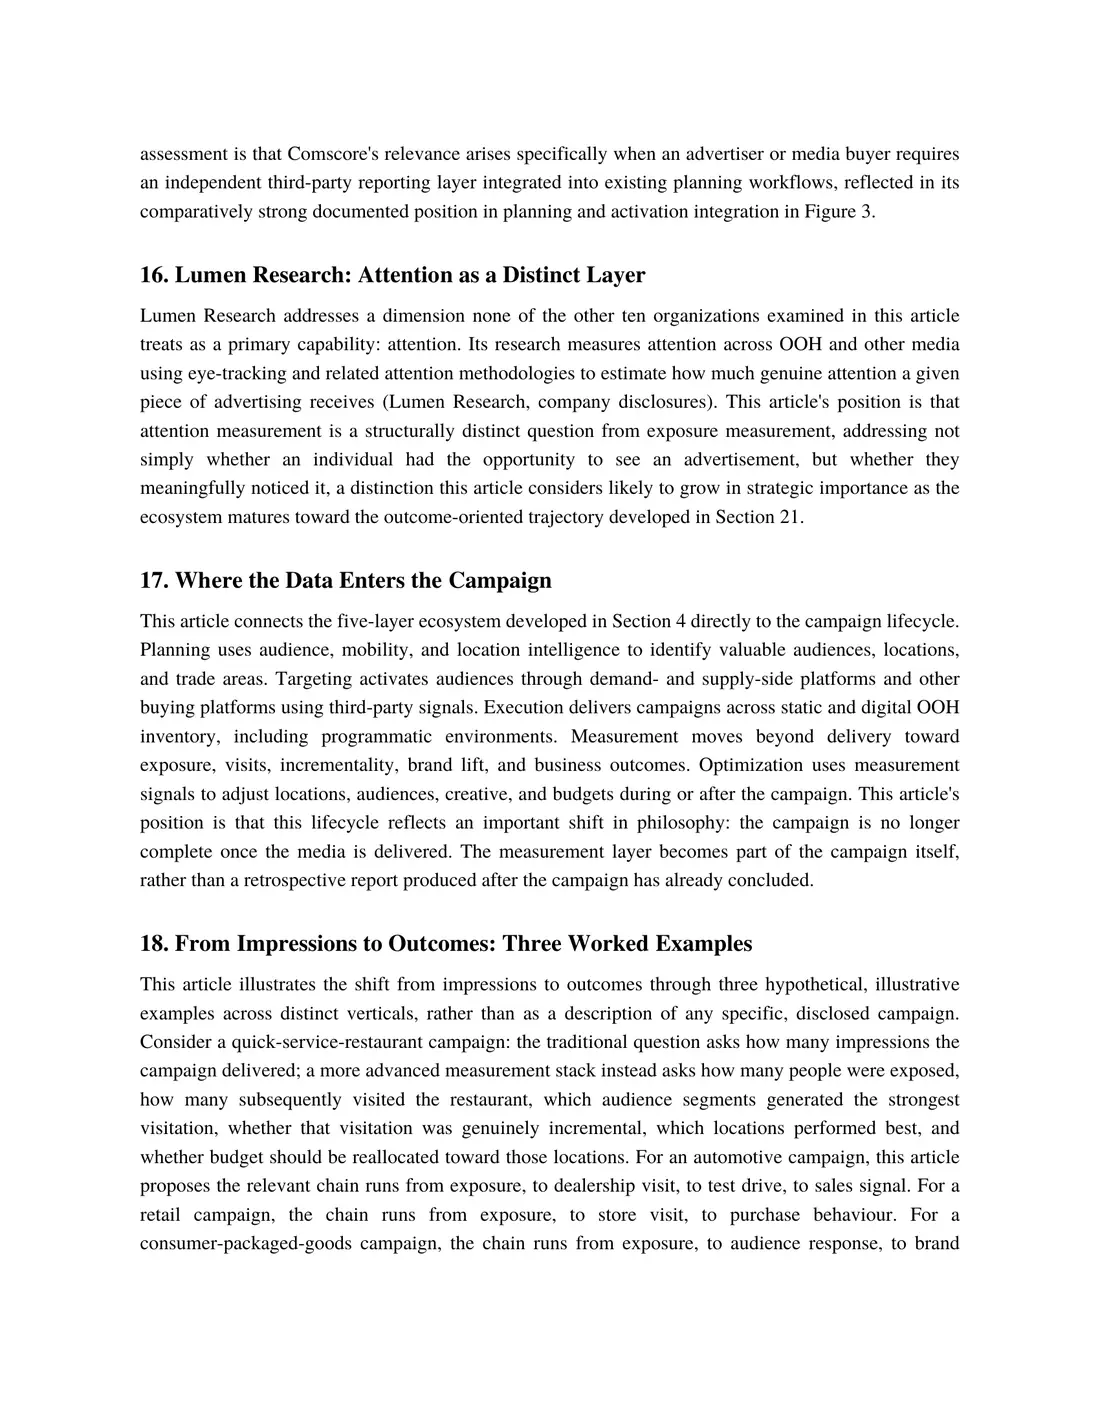
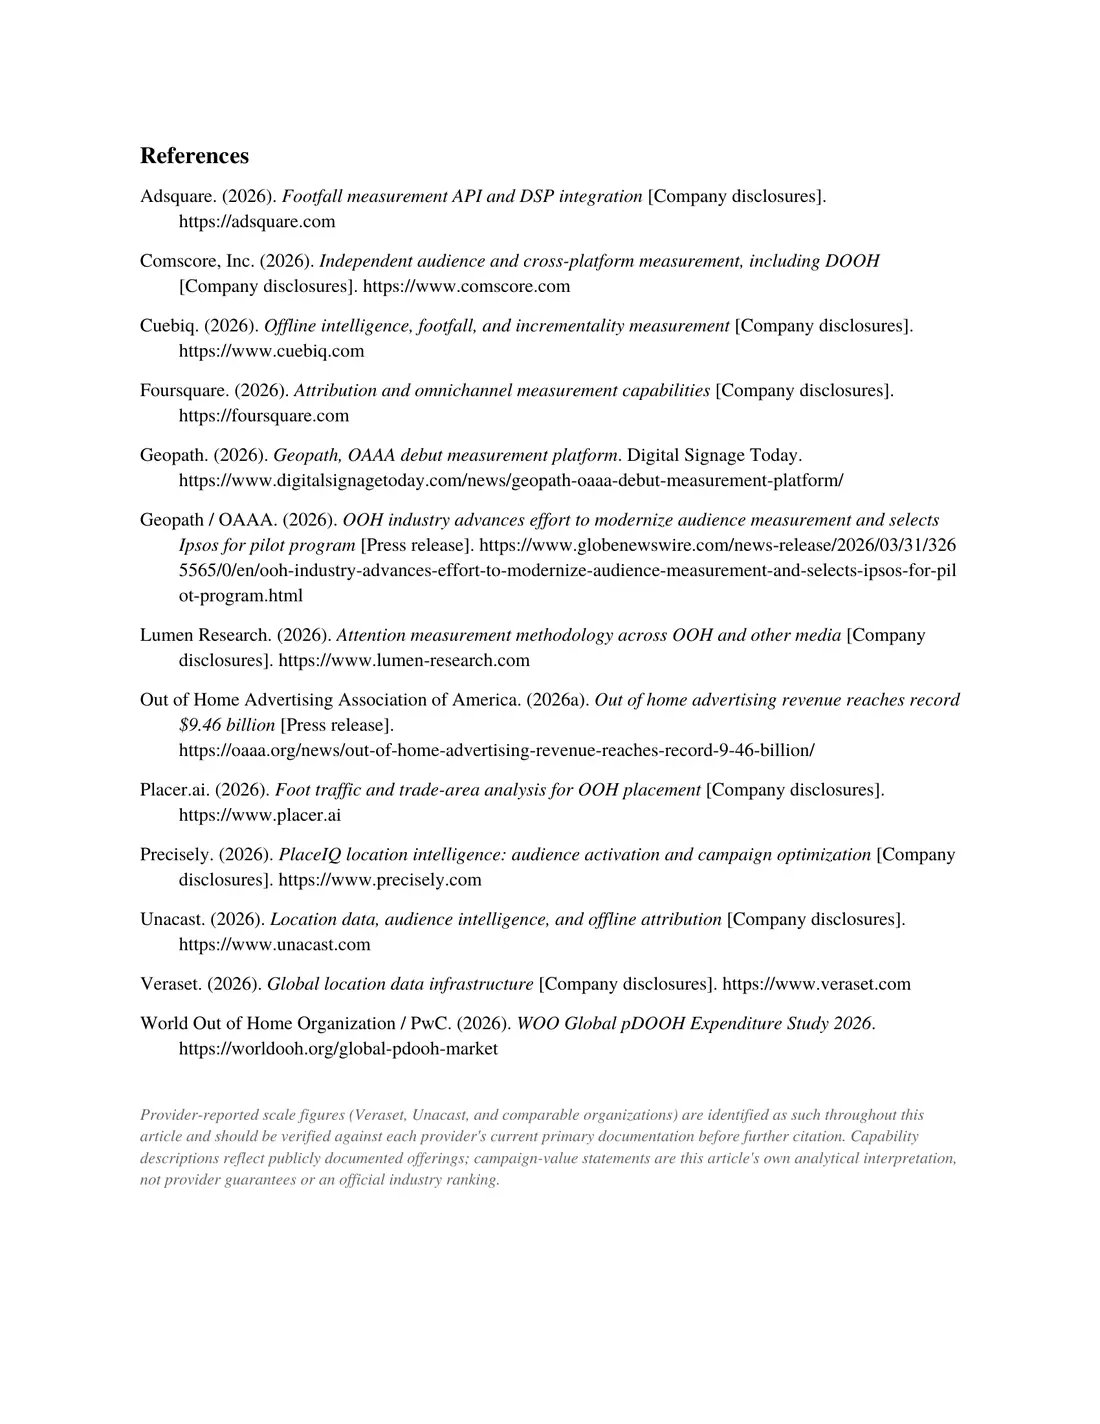
This article does not rank the eleven organizations examined in Sections 6 through 16 numerically, consistent with the position that documented capability across structurally different business types, raw location-data infrastructure, independent research organizations, and orchestration platforms, is not reducible to a single comparable score. Figure 3 instead presents a qualitative capability map across five dimensions, using categorical assessments of strong, moderate, or emerging documented capability.
Figure 3. Qualitative capability map across eleven organizations examined in this article's US OOH/DOOH data ecosystem review. Categories reflect this article's own synthesis of publicly documented capability and should not be read as a numerical ranking, performance score, or independently audited industry benchmark.
This article's reading of Figure 3 is that no organization examined rates strongly across all five dimensions simultaneously. Foursquare, Unacast, and Precisely/PlaceIQ present the broadest documented strength across location data, audience intelligence, and attribution jointly; Veraset and Placer.ai present strong, more narrowly scoped capability in raw location data specifically; and Lumen Research occupies a structurally distinct position, rating strongly only in attention measurement, a dimension none of the other ten organizations examined addresses as a primary capability.
6. Geopath: The Current Reference, in Transition
Geopath remains the current United States OOH audience-measurement reference while the industry develops its next-generation framework discussed in Section 3, supporting concepts including reach, frequency, and impressions across the US OOH inventory base (Geopath, company disclosures). This article characterizes Geopath's role as fundamentally an audience-measurement one, with the future-state system still under active development through the Ipsos-led pilot described in Section 3.
7. Ipsos: From Global Research to the US Measurement Pilot
Ipsos is currently participating directly in the US next-generation OOH measurement initiative described in Section 3, selected by Geopath and OAAA following a competitive process; Ipsos brings global audience-measurement and media-research expertise, including providing foundational data or fully productized OOH measurement systems in more than 20 markets worldwide, including the United Kingdom and Australia (Geopath/OAAA, 2026). This article's position is that Ipsos's role in this specific context is research and measurement leadership rather than that of an additional location-data supplier, distinguishing it structurally from most other organizations examined in this article.
8. Foursquare: Location Intelligence Connected to Attribution
Foursquare connects location intelligence with attribution and omnichannel measurement, with documented capability spanning OOH, digital, television, connected television, social, and audio channels, including visits and sales-impact measurement (Foursquare, company disclosures). This article's assessment is that Foursquare's particular relevance lies in connecting exposure to a subsequent, measurable real-world outcome, rather than supplying location signal alone.
9. Veraset: Raw Location-Data Infrastructure at Scale
Veraset provides large-scale location-data infrastructure, with current public documentation reporting coverage of approximately 300 million mobile devices across more than 200 countries and approximately 10 billion daily location pings worldwide (Veraset, company disclosures). This article treats these as provider-reported scale figures rather than an independently audited market certification, and characterizes Veraset's structural position as infrastructure supplying signal to downstream products, rather than a finished measurement or attribution offering in its own right.
10. Unacast: Location Data, Audience Intelligence, and Foot Traffic
Unacast provides location data, audience intelligence, foot-traffic analysis, and offline attribution, with documented use cases spanning audience creation, visitation analysis, location-based advertising, and OOH effectiveness measurement specifically (Unacast, company disclosures). This article's assessment is that Unacast's combination of location data and audience-intelligence capability, evidenced in Figure 3, positions it more broadly across the ecosystem than a single-layer specialist.
PlaceIQ's location-intelligence portfolio is now part of Precisely, which documents real-world audience activation, visitation intelligence, targeting, campaign optimization, and connections between media exposure and real-world outcomes (Precisely, company disclosures). This article's assessment is that Precisely's particular relevance lies in enterprise-scale geospatial data combined with activation capability, evidenced by its comparatively strong documented position across location data, audience intelligence, and planning and activation integration jointly in Figure 3.
12. Adsquare: The Orchestration Layer
Adsquare sits closer to the intelligence and orchestration layer of the ecosystem than to raw data supply, connecting audience, location, and measurement capabilities directly to planning and activation workflows; its measurement product can deliver visit data directly into demand-side platform environments (Adsquare, company disclosures). This article treats Adsquare as the clearest example, among the organizations examined, of a company positioned specifically at the connective layer between underlying data and activated campaign intelligence, consistent with the distinction developed in Section 4.
13. Cuebiq: Offline Incrementality Specifically
Cuebiq focuses on offline intelligence, footfall, incrementality, and cross-channel measurement, including OOH specifically, with documented capabilities spanning incremental visits and campaign optimization informed by offline outcomes (Cuebiq, company disclosures). This article's assessment is that Cuebiq's particular strength, reflected in Figure 3, is concentrated specifically in the attribution and outcomes dimension rather than distributed evenly across the ecosystem.
14. Placer.ai: Foot Traffic and Trade-Area Analysis
Placer.ai provides location intelligence and foot-traffic insight supporting trade-area analysis, OOH placement analysis, and audience and location planning (Placer.ai, company disclosures). This article characterizes Placer.ai as a location-data specialist whose primary documented strength, evidenced in Figure 3, lies in the underlying location-data layer itself rather than in audience segmentation or attribution specifically.
Comscore provides independent audience and cross-platform measurement, with documented DOOH measurement capability integrated into planning tools (Comscore, company disclosures). This article's assessment is that Comscore's relevance arises specifically when an advertiser or media buyer requires an independent third-party reporting layer integrated into existing planning workflows, reflected in its comparatively strong documented position in planning and activation integration in Figure 3.
16. Lumen Research: Attention as a Distinct Layer
Lumen Research addresses a dimension none of the other ten organizations examined in this article treats as a primary capability: attention. Its research measures attention across OOH and other media using eye-tracking and related attention methodologies to estimate how much genuine attention a given piece of advertising receives (Lumen Research, company disclosures). This article's position is that attention measurement is a structurally distinct question from exposure measurement, addressing not simply whether an individual had the opportunity to see an advertisement, but whether they meaningfully noticed it, a distinction this article considers likely to grow in strategic importance as the ecosystem matures toward the outcome-oriented trajectory developed in Section 21.
17. Where the Data Enters the Campaign
This article connects the five-layer ecosystem developed in Section 4 directly to the campaign lifecycle. Planning uses audience, mobility, and location intelligence to identify valuable audiences, locations, and trade areas. Targeting activates audiences through demand- and supply-side platforms and other buying platforms using third-party signals. Execution delivers campaigns across static and digital OOH inventory, including programmatic environments. Measurement moves beyond delivery toward exposure, visits, incrementality, brand lift, and business outcomes. Optimization uses measurement signals to adjust locations, audiences, creative, and budgets during or after the campaign. This article's position is that this lifecycle reflects an important shift in philosophy: the campaign is no longer complete once the media is delivered. The measurement layer becomes part of the campaign itself, rather than a retrospective report produced after the campaign has already concluded.
18. From Impressions to Outcomes: Three Worked Examples
This article illustrates the shift from impressions to outcomes through three hypothetical, illustrative examples across distinct verticals, rather than as a description of any specific, disclosed campaign. Consider a quick-service-restaurant campaign: the traditional question asks how many impressions the campaign delivered; a more advanced measurement stack instead asks how many people were exposed, how many subsequently visited the restaurant, which audience segments generated the strongest visitation, whether that visitation was genuinely incremental, which locations performed best, and whether budget should be reallocated toward those locations. For an automotive campaign, this article proposes the relevant chain runs from exposure, to dealership visit, to test drive, to sales signal. For a retail campaign, the chain runs from exposure, to store visit, to purchase behaviour. For a consumer-packaged-goods campaign, the chain runs from exposure, to audience response, to brand impact, to retail outcome. This article's position is that the specific data providers involved may differ by vertical and use case, but the underlying directional shift is consistent across all three: from delivery, to exposure, to behaviour, to business outcome.
19. The Real Opportunity Is Interoperability
This article's central structural argument is that the largest opportunity in this ecosystem likely does not belong to any single data provider; it belongs to the layer that connects them. A mobility provider can supply movement signals; a geospatial provider can describe places; an audience provider can construct segments; a measurement company can estimate exposure; an attribution provider can connect exposure to visits; and an attention company can estimate the quality of engagement. This article's position is that the value of each of these capabilities increases considerably when they can operate together rather than in isolation, and that this is precisely why interoperability, rather than any additional standalone dataset, is becoming strategically central to US OOH and DOOH.
20. Where Artificial Intelligence Fits
This article takes an explicit position on the role of artificial intelligence within this ecosystem: AI will not, on its own, resolve weak measurement. If the underlying data feeding an AI system is incomplete, inconsistent, or methodologically opaque, a large language model cannot manufacture measurement credibility that does not already exist in the underlying signal. This article's position is that AI instead becomes considerably more powerful once the underlying signals described in Sections 4 through 16 are properly structured and connected; a campaign-intelligence system capable of combining audience data, mobility signal, inventory, exposure, attribution, and attention could, in principle, answer a more demanding question than any single dataset can answer alone, evaluating which combination of audience, location, time, inventory, and creative is producing the strongest incremental outcome, and converting that evaluation into a specific recommendation. This article characterizes this shift as moving OOH from a reporting environment toward what this article terms an intelligence environment.
21. A Five-Stage Trajectory Toward 2030
This article proposes that the US OOH/DOOH measurement stack is progressing through five stages. The first stage, measurement, asks simply whether the advertising was delivered. The second, exposure intelligence, asks who had the opportunity to see the campaign. The third, attention intelligence, asks who actually noticed it, connecting directly to the capability examined in Section 16. The fourth, outcome intelligence, asks whether that exposure influenced behaviour. The fifth, optimization intelligence, asks whether the system can use those outcomes to improve the next decision. This article's position is that the final stage is where agentic systems could become particularly significant: rather than a planner simply receiving a static report, a future system may continuously interpret an active campaign, identify underperforming locations or audiences, recommend adjustments, and, within defined guardrails, execute approved optimizations directly.
22. Limitations
This article is a strategic and competitive analysis rather than an empirical study, and it deliberately avoids assigning numerical rankings to the organizations examined in Sections 6 through 16, consistent with the position stated in Section 5 that documented capability across structurally different business types is not reducible to a single comparable score. The market-scale figures in Sections 2 and 3 are drawn from named, dated primary sources, principally the Out of Home Advertising Association of America, the World Out of Home Organization's joint study with PricewaterhouseCoopers, and Geopath's own public disclosures regarding its measurement-modernization timeline. Provider-reported scale figures, including those attributed to Veraset, Unacast, and other organizations examined in this article, are identified explicitly as provider-reported rather than independently audited, and should be verified against each provider's current primary documentation before further citation. The three worked examples presented in Section 18 are explicitly hypothetical and illustrative, not descriptions of any specific, disclosed campaign. Given the pace of change evident throughout 2026, particularly the ongoing Geopath/OAAA/Ipsos measurement pilot described in Section 3, this article's characterization of the current measurement landscape should be verified against current primary sources before being relied upon for a strategic or investment decision.
23. Conclusion: The Billboard Is Only the Visible Layer
This article's closing argument is that the future of US OOH/DOOH measurement is unlikely to be defined by one additional, isolated dataset. It will instead be defined by how effectively already-fragmented signals become interoperable campaign intelligence. The winning architecture this article's evidence supports is accordingly not simply more data; it is better-connected data, producing better measurement, enabling better decisions, and ultimately producing better outcomes. The billboard, this article concludes, is only the visible layer of this ecosystem. The real infrastructure, spanning the five layers this article has examined from real-world signal through to optimized outcome, sits underneath it, and this article's central finding is that no organization currently connects that infrastructure end to end, which this article treats as the defining strategic opportunity in this category through the remainder of the decade.
References
Adsquare. (2026). Footfall measurement API and DSP integration [Company disclosures]. https://adsquare.com
Comscore, Inc. (2026). Independent audience and cross-platform measurement, including DOOH [Company disclosures]. https://www.comscore.com
Provider-reported scale figures (Veraset, Unacast, and comparable organizations) are identified as such throughout this article and should be verified against each provider's current primary documentation before further citation. Capability descriptions reflect publicly documented offerings; campaign-value statements are this article's own analytical interpretation, not provider guarantees or an official industry ranking.